


 FxWirePro- Major Crypto levels and bias summary
  FxWirePro- Major Crypto levels and bias summary
  FxWirePro-24-Hour Crypto Category-Based Performance Dashboard
  FxWirePro- Major Crypto levels and bias summary
  Bitcoin Surges Past $85,000 Amidst Rising Risk Appetite
  FxWirePro- Major Crypto levels and bias summary


 Add as a preferred source on Google
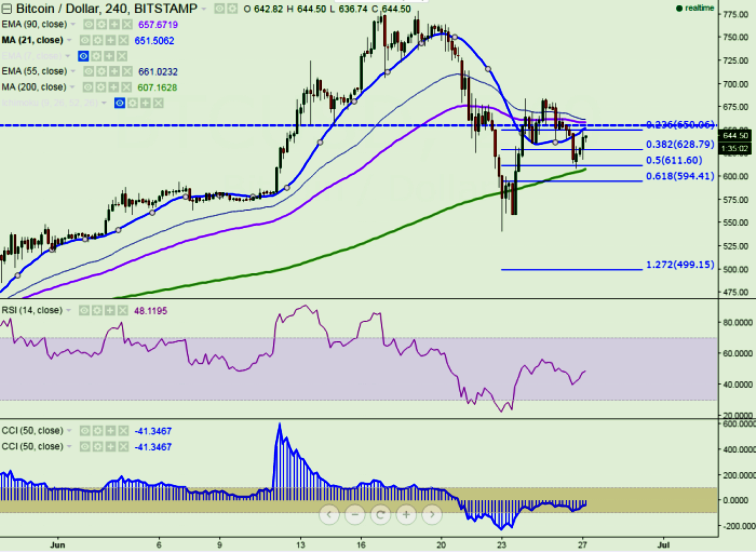
BTC/USD could not hold its levels seen post Brexit decision and fell to $608.64 levels on Sunday (Bitstamp). Today, the pair has touched a high of $649 levels so far in the day and currently trades at $646 levels, at press time.
Ichimoku analysis (4 Hour chart):
Tenkan-Sen level: $645
Kijun-Sen level: $612.31
Trend reversal level - (90 day EMA)-$657
Long-term trend is bullish and the major resistance is around $689 (61.8% retracement of $778 and $540) and any break above targets $725/$750. On the reverse side, short-term support is likely to be found at $605 (200 4H MA) and any violation below will drag the pair till $595 (61.8% retracement of $540 and $683)/$540 (Jun 23 rd low). Short-term trend remains weak.
“The pair has declined sharply after making a high of $685(25 Jun high). BTC/USD has taken support near 200 4HMA and jumped till $649 at the time of writing from that level. So a slight jump till $685/$725 is possible”, FxWirePro said in a statement.

- News

- Economy

- Central Banks
- Investing
- Research
- Roundups
- Digital Currency
- Insights
- Technical Analysis
- Technology
- Business
- Law
- Health
- Nature
- Fintech
- Science
- Topic
- Opinions
- ©Econometrics LLC . All Rights Reserved.
BTC/USD takes support near 200 4HMA, targets $685
Monday, June 27, 2016 6:57 AM UTC
Editor's Picks



- Market Data
Most Popular




