


 FxWirePro- Major Crypto levels and bias summary
  FxWirePro- Major Crypto levels and bias summary
  Ethereum Retreats in Bitcoin’s Shadow: ETH/USD Tests Critical Support at USD 2,075
  Bitcoin Retreats Toward Critical Support as Geopolitical Winds Shift
  Ethereum’s $2,200 Ceiling: Can Diplomatic Breakthroughs Dissolve the Bearish Resistance?


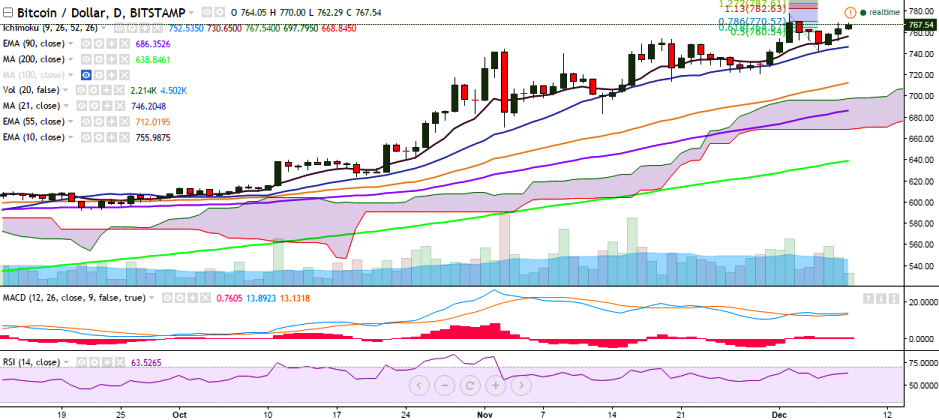
BTC/USD is consolidating in a narrow range and is currently trading at 768 levels at the time of writing (Bitstamp).
Long-term trend: Bullish
Short-term trend: Bullish
Ichimoku analysis of daily chart:
Tenkan Sen: 749.53
Kijun Sen: 730.65
Trend reversal: 684.52 (90 EMA)
The pair now faces resistance at 770.57 (78.6% retracement of 778.07 and 743) and only a consistent break above 778 (December 02 high) would confirm further bullishness in the pair. A breach of 778 levels would see it testing 800 levels.
On the down side, the pair has taken support near 753.42 (10-EMA) and a break below would target 743 (December 05 low)/714 (November 20 low).

- News

- Economy

- Central Banks
- Investing
- Research
- Roundups
- Digital Currency
- Insights
- Technical Analysis
- Technology
- Business
- Law
- Health
- Nature
- Fintech
- Science
- Topic
- Opinions
- ©Econometrics LLC . All Rights Reserved.
BTC/USD faces resistance at 78.6% fib, further bullishness only above 780
Thursday, December 8, 2016 11:10 AM UTC
Editor's Picks


- Market Data
Most Popular


