


 FxWirePro- Major Crypto levels and bias summary
  Ethereum Trails Bitcoin’s Retreat: Key Support Levels in Focus
  Ethereum Retreats in Bitcoin’s Shadow: ETH/USD Tests Critical Support at USD 2,075
  Ethereum’s $2,200 Ceiling: Can Diplomatic Breakthroughs Dissolve the Bearish Resistance?
  FxWirePro- Major Crypto levels and bias summary
  FxWirePro- Major Crypto levels and bias summary
  BTCUSD Coils in Tight Range: Will Geopolitical Stability Trigger a Breakout Toward $80,000?
  Bitcoin Retreats Toward Critical Support as Geopolitical Winds Shift


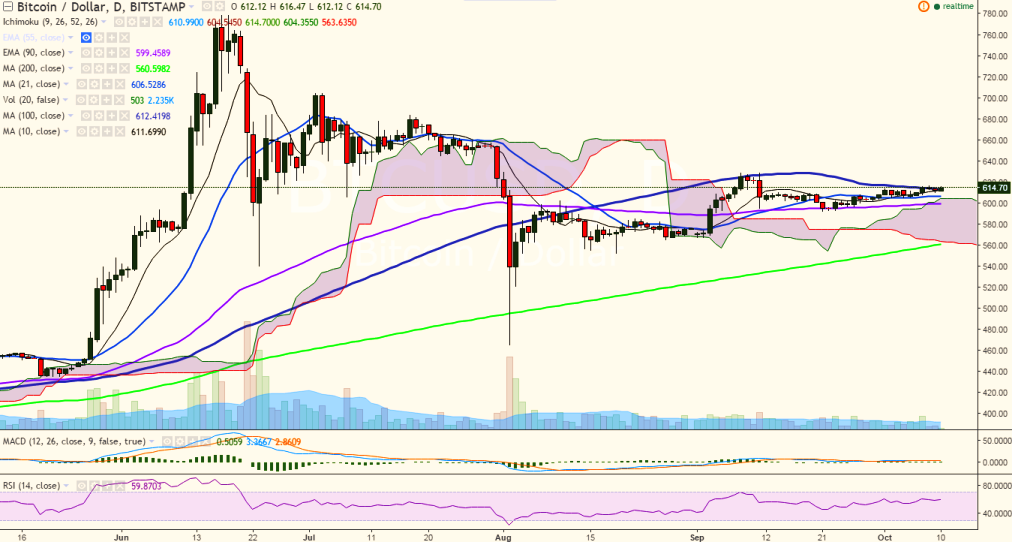
BTC/USD has broken above 100-day MA and has hit 616.47 levels so far in the day. It is currently trading at 614.50 levels (Bitstamp).
Long-term trend: Bullish
Short-term trend: Bullish
Ichimoku analysis of daily chart:
Tenkan Sen: 610.99
Kijun Sen: 604.54
Trend reversal: 599.11 (90 EMA)
On the upside, the pair will face resistance at 628.99 (September 11 high) and a break above would target 651.79 (161.8% retracement of 628.99 and 592.10)/ 704.99 (July 03 high)
On the flip side, the pair seems have taken support near 611.05 (10-day MA) and a consistent break below would weaken it to 599.11 (90 EMA)/552.30 (August 19 low).

- News

- Economy

- Central Banks
- Investing
- Research
- Roundups
- Digital Currency
- Insights
- Technical Analysis
- Technology
- Business
- Law
- Health
- Nature
- Fintech
- Science
- Topic
- Opinions
- ©Econometrics LLC . All Rights Reserved.
BTC/USD breaks above 100-DMA, targets 630
Monday, October 10, 2016 7:18 AM UTC
Editor's Picks


- Market Data
Most Popular


