


 Ethereum’s $2,200 Ceiling: Can Diplomatic Breakthroughs Dissolve the Bearish Resistance?
  BTCUSD Coils in Tight Range: Will Geopolitical Stability Trigger a Breakout Toward $80,000?
  FxWirePro- Major Crypto levels and bias summary
  Ethereum Trails Bitcoin’s Retreat: Key Support Levels in Focus
  FxWirePro- Major Crypto levels and bias summary
  Ethereum Retreats in Bitcoin’s Shadow: ETH/USD Tests Critical Support at USD 2,075
  Bitcoin Retreats as Geopolitical Tensions Flare: BTC/USD Dips Following Iran’s Rejection of Ceasefire


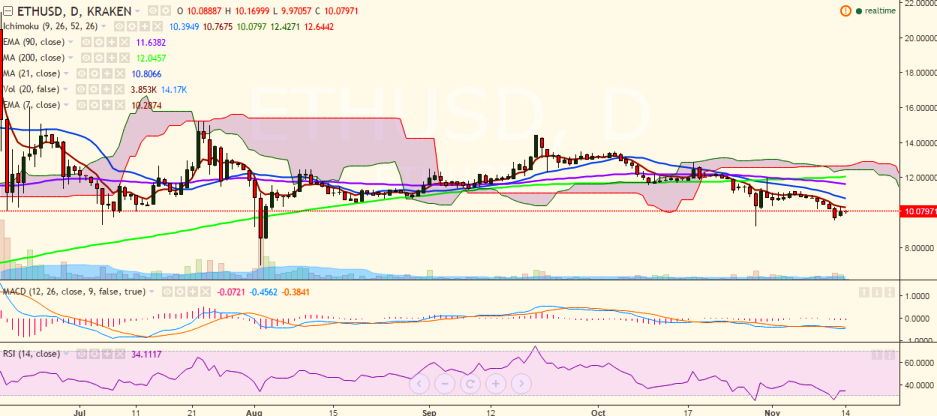
BTC/GBP briefly broke above 21-day MA on Tuesday and hit 589.79 levels. However, it failed to hold its strength and is currently trading at 574 levels (Coinbase).
Long-term trend: Bullish
Short-term trend: Bullish
Ichimoku analysis of daily chart:
Tenkan Sen: 574.24
Kijun Sen: 559.74
Trend reversal: 514.76 (90 EMA)
The pair’s upside is being capped by 589.71 levels (78.6% retracement of 601.29 and 547.20) and a break above would find the next resistance at 601.29 levels (November 09 high)/611.12 (November 03 high).
On the downside, support is likely to be found at 547.20 (November 13) and a break below would drag the pair to 535.30 (November 03 low)/ 514.76 (90 EMA).

- News

- Economy

- Central Banks
- Investing
- Research
- Roundups
- Digital Currency
- Insights
- Technical Analysis
- Technology
- Business
- Law
- Health
- Nature
- Fintech
- Science
- Topic
- Opinions
- ©Econometrics LLC . All Rights Reserved.
BTC/GBP hovers around 21-DMA, close above targets 611
Tuesday, November 15, 2016 9:11 AM UTC
Editor's Picks


- Market Data
Most Popular


