


 FxWirePro- Major Crypto levels and bias summary
  FxWirePro- Major Crypto levels and bias summary
  Bitcoin Sheds $491M in ETF Outflows and Retreats Below $64K; Sellers Reload for $50K


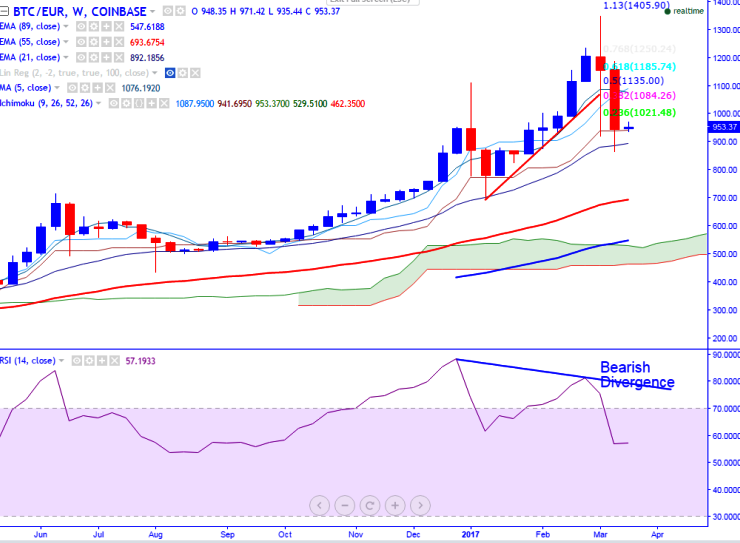
Bitcoin rose almost 50% in this year 2017 from the low of $694. The pair jumped till $1350 on Mar 10th 2017 and shown a steep fall after SEC rejects Bitcoin ETF. BTC/EUR breaks major support at 920 low formed after BTC ETF rejection and declined till 864 from that level (COINBASE). BTC/EUR slightly recovered till 995 after the huge sell-off. It has shown minor decline below 21- W EMA and any close below that level will confirm further weakness.
Ichimoku analysis of weekly chart shows:
Tenkan-Sen level: 1064
Kijun-Sen level: 938
Major reversal level -694 (Jan 2017 low)
RSI (Weekly chart) - Bearish Divergence
Long-term trend remains to be bullish. On the lower side, major near-term support is around $812 (61.8% retracement of 694 and 1350) and any close below that level will drag the pair till $694 (Jan 2017 low).
In the weekly chart, BTC/EUR has formed bearish divergence, a decline till $694 likely. Short term bullish invalidation only below $694. Any close below $694 will drag the pair till $434 (Aug 2016 low). On the higher side, near term resistance is around $1350 and any break above confirms bullish continuation, a jump till $1500/$1650 (161.8% retracement of $1350 and $864) is possible.

- News

- Economy

- Central Banks
- Investing
- Research
- Roundups
- Digital Currency
- Insights
- Technical Analysis
- Technology
- Business
- Law
- Health
- Nature
- Fintech
- Science
- Topic
- Opinions
- ©Econometrics LLC . All Rights Reserved.
BTC/EUR faces strong support at 21-WEMA, close below targets 694
Monday, March 20, 2017 9:15 AM UTC
Editor's Picks


- Market Data
Most Popular


