


 NZDJPY Faces Downward Pressure as 95.40 Resistance Holds Firm
  FxWirePro: USD/CAD rises above 1.3900 level after Warsh's Jackson hole speech
  FxWirePro- Major Crypto levels and bias summary
  EURUSD Trades Flat Amidst NFP Revision and Jackson Hole Ahead; Technicals Suggest Buying Opportunity
  FxWirePro: GBP/USD slips lower as dollar firms after Warsh comments
  Bitcoin Dips Before the Flip: Whales Load Up $3B as $80K Rebound Looms
  FxWirePro: USD/ZAR bears maintain upper hand
  AUD/JPY: Bullish Momentum Continues in JPY Major Pairs
  FxWirePro:EUR/NZD gains some ground but outlook is bearish
  FxWirePro- Major Crypto levels and bias summary


 Add as a preferred source on Google
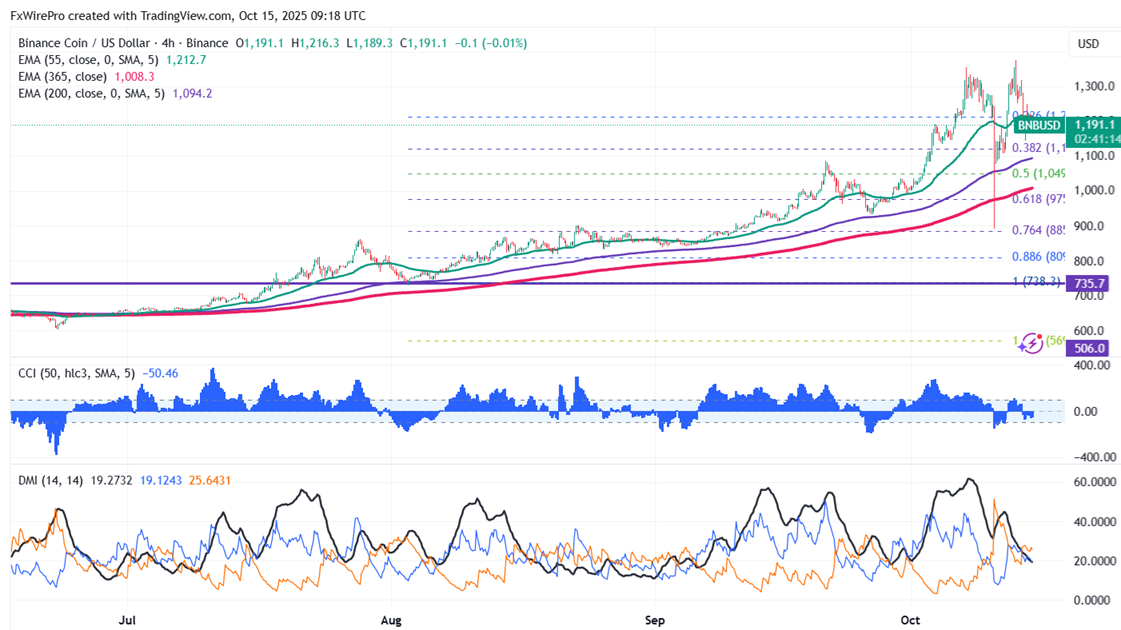
BNBUSD trades in a narrow range after a minor sell-off from a fresh all-time high. It hit an intraday high of $1216 and is currently trading around $1198.
Oscillators and moving averages to forecast the trend of BNBUSD
CMP- $1180.8
EMA (4-hour chart)
55-EMA- $1213.50
200-EMA- $1093.30
365-EMA- $1007. The pair trades above both short-term and long-term moving averages.
Major support - $1130. Any breach below $1130 will drag the pair down to $1086/$1044/$985/$930.
Major Resistance - $1250. Any break above $1250 confirms minor bullishness; a jump to $1300/$1376/$1400/$1500 is possible.
Indicators (4-hour chart)
CCI(50)- Bearish
ADX- Neutral
Investment Strategy for BNBUSD
It is good to buy on dips around $1130 with a stop loss around $1100 for target profits of $1300/$1350.







