


- News

- Economy

- Central Banks
- Investing
- Research
- Roundups
- Digital Currency
- Insights
- Technical Analysis
- Technology
- Business
- Law
- Health
- Nature
- Fintech
- Science
- Topic
- Opinions
- ©Econometrics LLC . All Rights Reserved.
Neufund, BitBay collaborate to enable security token trading with fiat currencies
Aug 03, 2018 08:52 am UTC| Digital Currency
Neufund, a blockchain-based equity fundraising platform, is teaming up with European cryptocurrency exchange BitBay to allow investors to buy and sell equity tokens with fiat currencies. The announcement follows...
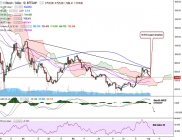
FxWirePro: BTC/USD trades lower following breach of 90-EMA support, good to go short on rallies
Aug 03, 2018 07:33 am UTC| Digital Currency Technicals
BTC/USD is trading lower on Friday as it broke below 90-EMA. The pair is currently trying to hold 55-EMA support and trading at 7324 levels at the time of writing (Bitstamp). On the topside, resistance is seen at...
Huobi OTC platform lays down yet another milestone by launching EOS trading
Aug 03, 2018 06:33 am UTC| Research & Analysis Digital Currency Insights & Views Commentary
Huobi exchange launches EOS cryptocurrency in its platform as of 1st August. Huobi, over-the-counter (OTC) division has recently announced to offer Indian users trading facility onBitcoin(BTC),Ethereum(ETH),...
Aug 03, 2018 06:18 am UTC| Digital Currency Fintech
Boerse Stuttgart, the second largest stock exchange in Germany, has announced its plans to offer central services along the value chain for digital assets under one roof. The company on Thursday announced an end-to-end...
Aug 03, 2018 05:16 am UTC| Digital Currency Fintech
South Koreas Financial Supervisory Service (FSS) is encouraging domestic companies and regulatory authorities to collaborate on developing an integrated blockchain platform for stock trading, Korea Joongang Daily...
Digital Currency Group, ZhenFund and others back Logos Network’s $3M seed round
Aug 03, 2018 04:18 am UTC| Digital Currency
Decentralized payments platform Logos Network has announced that it has raised $3 million in a seed funding round through its Logos US Fund. The funding round saw participation from ZhenFund, Digital Currency Group,...
UniCredit completes first blockchain-based international transaction via we.trade
Aug 03, 2018 03:27 am UTC| Digital Currency
Italian financial services giant UniCredit has successfully completed its first international transaction via blockchain-based trading platform we.trade. UniCredit is one of the founding members of we.trade an...


IEA Warns China Rare Earth Export Curbs Could Threaten $6.5 Trillion in Global Production

U.S. Imposes 25% Tariff on Select Brazilian Imports After Section 301 Trade Investigation

Gold Prices Slip as Oil Rally Fuels Inflation Fears, Strengthens Dollar

Asian Stocks Slide as Chip Selloff Deepens Ahead of TSMC Earnings

Asian Currencies Hold Steady as Middle East Tensions Offset Weaker US Dollar

DOJ Refuses to Release Unredacted Jeffrey Epstein Files to New Mexico Investigation

US Restricts Commercial Flights From Congo Amid Ebola Outbreak

NY Times Challenges Trump Administration Subpoenas Over Air Force One Report

Trump Orders ICE to Resume Traffic Stops After Deadly Immigration Enforcement Incidents

Russian Missile Strike Sparks Fires in Kyiv After Early Morning Air Alert

Blue Origin New Glenn Explosion Could Delay Launch Operations Until 2028

Blue Origin New Glenn Rocket Explodes During Launch Pad Test, Delaying Space Ambitions

SpaceX Delays Starship V3 Launch Ahead of Potential Record IPO

Trump Administration Releases New UFO Files and Apollo Mission Records

China vs. NASA: The New Moon Race and What's at Stake by 2030

Apple Intelligence China Approval Lifts Alibaba and Baidu Shares

Nvidia Partners With Fanuc and Yaskawa to Accelerate AI Robotics in Japan

Hyundai Takes Full Control of Boston Dynamics to Accelerate Humanoid Robot and AI Strategy

Jamie Dimon Warns Anthropic's Mythos AI Poses National Security Risks

SpaceX Stock Falls Below IPO Price as Investors Weigh Losses and Lockup Expiry


- Market Data


