


 FxWirePro: GBP/AUD uptrend loses steam, remains on bullish path
  FxWirePro: USD/CAD slips on softer US payrolls but near-term direction hinges on 1.4154 support
  USDCHF Faces Downside Risk as Resistance Holds; Sell Rallies Recommended
  FxWirePro: EUR/USD jumps to eight-session high after weak U.S. jobs data
  FxWirePro: USD/CAD consolidating around 1.4200 room for further gains
  NZDJPY: Caught Between a Rock and a Hard Place – Will the Downtrend Prevail?
  FxWirePro- Major Crypto levels and bias summary
  FxWirePro: AUD/USD rallies as traders scale back Fed rate hike bets
  FxWirePro: EUR/USD edges higher but rally stalls below post-NFP peak
  FxWirePro USD/JPY dips as Yen gains after Japan reaffirms FX intervention readiness
  Gold Surges Above $4100 on Weak US Jobs Data; Bullish Momentum Builds
  FxWirePro: AUD/USD slips following softer TD-MI inflation gauge
  FxWirePro: NZD/USD advances as weak U.S. payrolls pressure greenback
  FxWirePro: USD/ZAR downside pressure builds, key support level in focus
  ETHUSD Forms Double Bottom at $1500, Signaling Potential Bullish Reversal


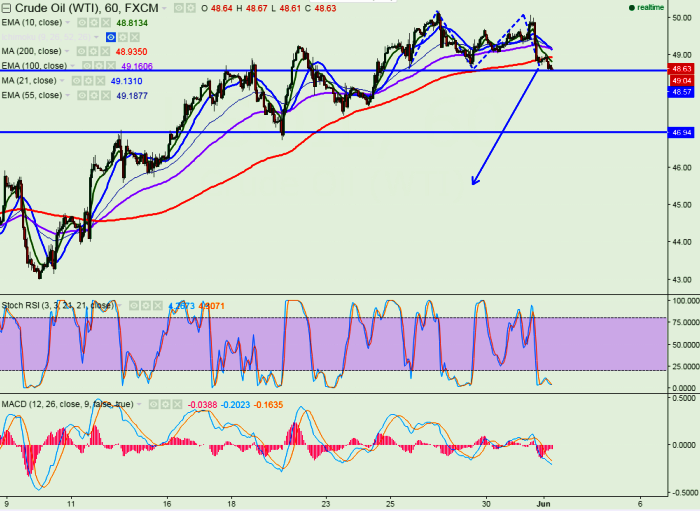
- Pattern Formed -M- shaped pattern
- Major support $48.60
- US oil has jumped till $50.08 yesterday but not able break above $50.18 high made on May 26th 2016.
- The recent rally in WTI crude was fuelled by militants attacks on pipelines and oil infrastructure in the southern Niger delta have crippled the production in Nigeria.
- Exports have expected to dropped to 990000 barrels per day from 2.2 million barrels per day .
- Crude oil prices is expected to show a technical correction in coming days as OPEC meeting and Fed rate hike looms.
- Technically any break below $48.60 will drag the US oil till $46.60/$45 in short term.
- On the higher side it should break above $50.18 for further bullishness. Any indicative break above targets $50.90/$51.50.
It is good to sell below $48.60 with SL around $50.10 for the TP of $46.55/$45


