


 FxWirePro- Woodies pivot (Major)
  FxWirePro:USD/JPY climbs back above 160.00 after BOJ rate decision
  FxWirePro: GBP/USD rises as soft US data pressures dollar
  FxWirePro: USD/ZAR gains as stronger dollar outweighs upbeat South Africa's trade surplus
  FxWirePro- Woodies pivot (Major)
  US Magnificent 7 Stocks Trend Score: Amazon & Microsoft Hit Extreme Bullish (+100) as Meta Drops to -100 — Key Resistance & Support Watchlist
  FxWirePro- Major Pair levels and bias summary
  FxWirePro: USD/CAD retreats after Canada posts stronger-than-expected GDP growth
  Major European Indices Score Extremely Bullish: DAX Eyes 26000, CAC Targets 8600, FTSE100 at 11000 – Key Levels to Watch
  FxWirePro- Major Crypto levels and bias summary
  Nikkei Surges Past 65,000 on Suspected Yen Weakness: Tech Giants Like Advantest and NEC Lead Explosive Gains
  FxWirePro- Major Crypto levels and bias summary
  US Magnificent 7 Stocks Trend Score: Amazon & Microsoft Hit Extreme Bullish (+100) as Meta Drops to -100 — Key Resistance & Support Watchlist
  FxWirePro: EUR/ AUD dips below 1.6400 level, focus on near term support
  AUDJPY Volatile After Massive Sell-Off: Sell Rallies at 113, Targeting 110 as Bearish Momentum Surges
  FxWirePro: GBP/NZD remains weak, eyes 38.2%fib support


Candlestick pattern- Shooting star
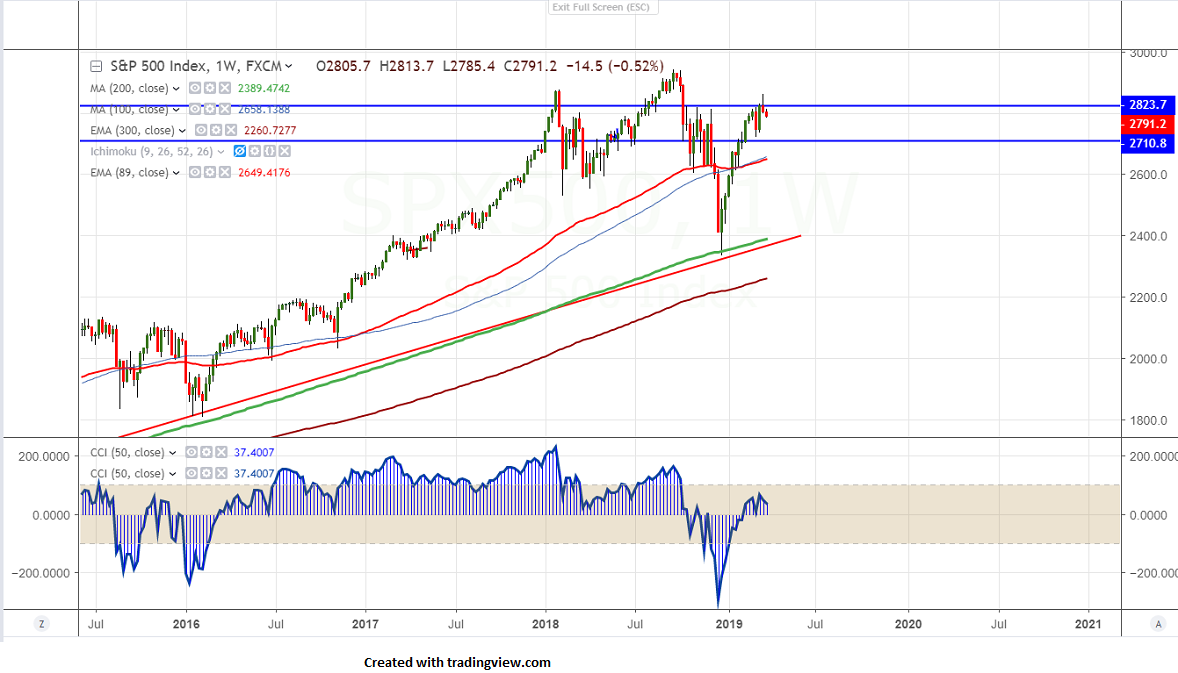
S&P500 has halted its one week of winning streak and shown massive sell-off on Friday on declining US 10 year yield. The index jumped more than 5% from low of 2720. US 3 month yield trades above US 10 year yield for the first time since 2007. It hits intraday low of 2785.40 and is currently trading around 2791.90.
The near term support is around 2775 (61.8% fib) and any break below will take the index to next level till 2753 (200- day MA)/2720-30 (89- day EMA). Any break below 2720 confirms further weakness.
On the lower side, resistance is at 2820 and any violation above targets 2840/2860. Any break above will take the index till 2900/2930.
It is good to sell on rallies around 2815-20 with SL around 2840 for the TP of 2753/2720.


