FxWirePro:FTSE100 forms bearish crossover, good to sell on rallies
Tuesday, December 6, 2016 9:44 AM UTC
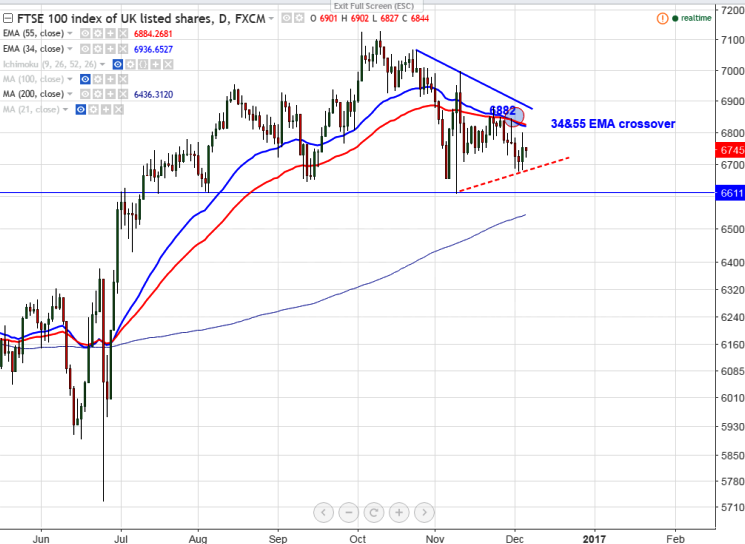
- Major resistance – 6885 (Nov 23rd high)
- Major support -6610
- Bearish Crossover (34- day EMA and 55- day EMA).
- The index forms temporary bottom around 6678 on Dec 2nd 2016 low and slightly shown a jump from that level. It is currently trading around 6742.
- The bearish crossover (34- day EMA and 55- day EMA) in the daily chart confirms minor weakness.
- On the higher side, major resistance is around 6885 and any violation above that level will take the index till 7000/7130.The 7130 level is the temporary top formed on Oct 11th 2016.
- The major support of the index stands at 6609 the low formed on Nov 9th and any indicative break below targets 6530 (200- day MA)/6435 (Jul 6th low).
It is good to sell on rallies around 6775-6780 with SL around 6885 for the TP of 6615/6540