


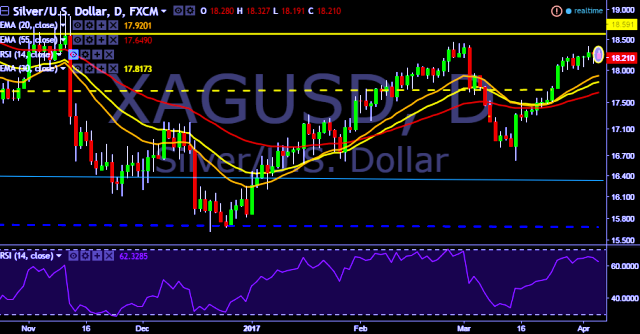
- XAG/USD is currently trading around $18.20 marks.
- It made intraday high at $18.32 and low at $18.19 levels.
- Intraday bias remains bearish till the time pair holds key resistance at $18.32 mark.
- A daily close above $18.28 will test key resistances at $18.32/$18.40/$18.48/$18.72 marks respectively.
- On the other side, a daily close below $18.28 will take the parity down towards key supports at $18.17/$18.00/$17.90/$17.72/$17.51/$17.42/$17.22/$17.09/$16.87/$16.65 marks respectively.
- Important to note here that 20D, 30D and 55D EMA heads up and confirms the bullish trend in a daily chart. Current downside movement is short term trend correction only.
We prefer to go short on XAG/USD around $18.22 with stop loss at $18.32 and target of $18.00.


