


 Oil Prices Dip Slightly Amid Focus on Russian Sanctions and U.S. Inflation Data
  U.S. Stocks vs. Bonds: Are Diverging Valuations Signaling a Shift?
  Geopolitical Shocks That Could Reshape Financial Markets in 2025
  Stock Futures Dip as Investors Await Key Payrolls Data
  Mexico's Undervalued Equity Market Offers Long-Term Investment Potential
  Fed May Resume Rate Hikes: BofA Analysts Outline Key Scenarios
  Moody's Upgrades Argentina's Credit Rating Amid Economic Reforms
  Goldman Predicts 50% Odds of 10% U.S. Tariff on Copper by Q1 Close
  UBS Projects Mixed Market Outlook for 2025 Amid Trump Policy Uncertainty
  China’s Growth Faces Structural Challenges Amid Doubts Over Data
  Energy Sector Outlook 2025: AI's Role and Market Dynamics
  UBS Predicts Potential Fed Rate Cut Amid Strong US Economic Data
  Global Markets React to Strong U.S. Jobs Data and Rising Yields
  U.S. Banks Report Strong Q4 Profits Amid Investment Banking Surge
  Trump’s "Shock and Awe" Agenda: Executive Orders from Day One
  U.S. Treasury Yields Expected to Decline Amid Cooling Economic Pressures


Crude oil futures for February delivery on the NYME tacked on 21 cents, or 0.39%, edges higher to $54.11 a barrel by 09:20GMT, after climbing 88 cents, or 1.66%, a day earlier. This bullish sentiment is majorly due to less than a week left before major global oil producers begin to scale back production in line with the deal they struck last month.
The recent OPEC’s agreement to cut output by 1.2 Mb/d from January next year together with the possibility of non-OPEC cuts of some 600 kb/d should result in meaningful global oil stock draws next year (even if full compliance is unlikely).
Therefore, we could foresee the scope for WTI to approach $60 by end-17. Annual global oil demand growth is forecast at a healthy 1.25 Mb/d in 2016 and 1.26 Mb/d in 2017, driven by emerging markets, especially China, India, and other non-OECD Asia.
WTI has averaged in the $45-50 range since Q2’16 and due to the persistent contango on the forward curve (front-month vs one-year forward timespreads have consistently been in the $3-6 range), producers have been able to lock in higher prices through hedging (selling forward). The prospect of a gradual recovery in US shale production next year is likely to slow the uptrend in oil prices.
The implied volatilities of crude oil options have dropped sharply on the back of last week’s OPEC deal. For example, the 3m at-the-money WTI implied volatility has dropped a massive 10 pctage points to about 33% since the OPEC announcement to cut output by 1.2 Mb/d.
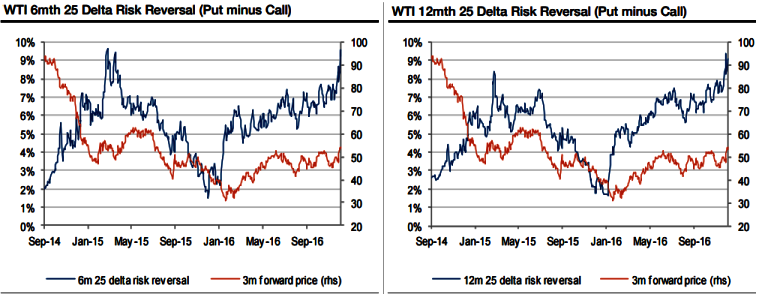
As we have mentioned before, we believe that the return of OPEC to active supply management is like to result in 3m implied crude vols trading below 30% to around 25% over time. Notably, you could also observe risk reversal curve is clearly followed by crude forwards curve.
The charts above should make it easy to decide whether to use a simple vanilla long call (put) option strategy or a long call spread (put spread) in order to benefit from a given 3m view on the underlying forward price.
The right side charts, demonstrates 1x1.5 option spreads based on the optimised strikes from the 1x1 option spreads.
The 1x1.5 option spreads would be net profitable at expiry if the forward price moves by a % between the blue and light grey lines but increasingly loss-making beyond the grey line.
The brown line represents maximum profit at expiry which would be considerable higher than a gross profit of 4 times premium paid.
Optimised 1x1 call and put options are shown in the leftside chart: the blue line represents the long strike, measured as a % away from the forward price; and the brown line represents both the short strike and the smallest possible move in the forward price that would generate a gross profit of 4 times premium paid at expiry.


