


 FxWirePro: AUD/USD gains some ground but outlook is bearish
  FxWirePro: GBP/USD rises as soft US data pressures dollar
  FxWirePro- Major Crypto levels and bias summary
  FxWirePro: GBP/AUD bears maintain upper hand
  FxWirePro: USD/ZAR gains as stronger dollar outweighs upbeat South Africa's trade surplus
  NZDJPY Retreats on Yen Strength – Bearish Setup Targets 90 After Hitting 92.75 Low
  FxWirePro: EUR/ AUD dips below 1.6400 level, focus on near term support
  JPY Currency Meter Signals: NZDJPY Bullish (+25) vs CHFJPY (-100) – These Pairs Could Move Next
  Nikkei Surges Past 65,000 on Suspected Yen Weakness: Tech Giants Like Advantest and NEC Lead Explosive Gains
  US Magnificent 7 Stocks Trend Score: Amazon & Microsoft Hit Extreme Bullish (+100) as Meta Drops to -100 — Key Resistance & Support Watchlist
  All Major JPY Pairs Hit Extreme Bearish Score of -100: USDJPY, EURJPY, GBPJPY, AUDJPY, NZDJPY & CADJPY Flash Maximum Weakness
  FxWirePro: GBP/NZD remains weak, eyes 38.2%fib support
  FxWirePro: AUD/USD cedes early gains ,outlook bearish
  FxWirePro: GBP/AUD drifts lower after BOE rate decision
  FxWirePro: USD/JPY dips as market assess risk of additional FX intervention.


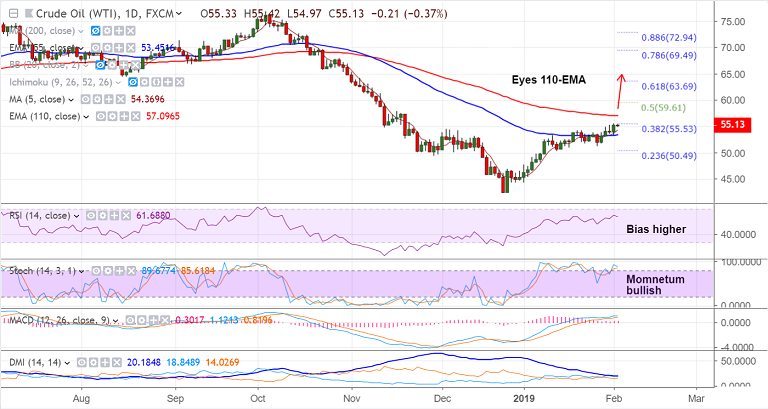
U.S. oil chart on Trading View used for analysis
- WTI consolidates Friday's gains, holds in a narrow range with session high at 55.43 and lows at 54.97.
- Tightening supplies and dovish Fed which will keep the USD subdues are likely to support prices higher.
- OPEC Jan output by the largest amount in two years and Russian oil output also declined to 11.38 million barrels per day in Jan.
- Further, Bakers Hughes data released on Friday showed the operating oil rigs in the US fell to their lowest in eight months.
- That said, US-China trade war concerns pose a risk to oil upside. Worsening negotiations could put pressure on prices.
- Technical studies are biased higher. Price action is on track to test next resistance at 110-EMA at 57.09. Break above cloud to see further gains.
- On the flipside, we see strong support at 55-EMA at 53.45, break below to see major weakness.
Support levels - 54.37 (5-DMA), 53.45 (55-EMA), 50.49 (23.6% Fib)
Resistance levels - 55.53 (38.2% Fib), 57.09 (110-EMA), 59.61 (50% Fib)
For details on FxWirePro's Currency Strength Index, visit http://www.fxwirepro.com/currencyindex.


