


 FxWirePro- Major Crypto levels and bias summary
  U.S. Stocks vs. Bonds: Are Diverging Valuations Signaling a Shift?
  FxWirePro: GBP/NZD gaining momentum for a move towards 2.3350level
  AUDJPY Bears Take a Breather at 111.50, But ‘Sell on Rallies’ Still Eyes 110
  Energy Sector Outlook 2025: AI's Role and Market Dynamics
  UBS Predicts Potential Fed Rate Cut Amid Strong US Economic Data
  China's Refining Industry Faces Major Shakeup Amid Challenges
  FxWirePro: GBP/AUD sustains gains as uptrend remains strong
  FxWirePro: GBP/USD slides toward critical support market reassesses UK political transition
  FxWirePro: USD/CAD hits 14-month high , Scope for further upside
  Moody's Upgrades Argentina's Credit Rating Amid Economic Reforms
  EURJPY Bounce Loses Steam Below 184 — Sell-the-Rally Setup Eyes 183 Target
  FxWirePro: AUD/USD drifts lower, uninspired by jobs beat
  UBS Projects Mixed Market Outlook for 2025 Amid Trump Policy Uncertainty
  Wall Street Analysts Weigh in on Latest NFP Data
  FxWirePro- Major Pair levels and bias summary


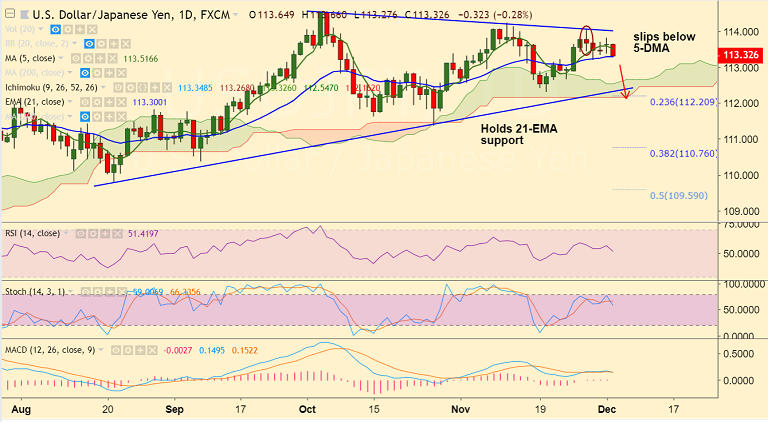
USD/JPY chart on Trading View used for analysis
- USD/JPY is seeing sharp downside from highs of 113.66 hit earlier today.
- The major is currently trading 0.29% lower on the day at 113.31 at the time of writing.
- US-China trade truce boosts the demand for the riskier currencies, sending the Dollar lower.
- Price action has dipped below 1H 200 SMA and we see a turn in the 5 day moving average.
- Price action is currently holding support at 21-EMA and break below will see further weakness.
- Next major support lies at 112.55 (cloud top). Breach at daily cloud will see weakness till trendline support at 112.30.
- On the flipside, we see major resistance at 114 (trendline). Break above will see further upside.
Recommendation: Stay short below 21-EMA, target 112.55/ 112.30
For details on FxWirePro's Currency Strength Index, visit -http://www.fxwirepro.com/currencyindex.


