


 NZDJPY Bullish Rebound: Buy Dips as EMAs Align for 97 Target
  FxWirePro- Major Pair levels and bias summary
  FxWirePro: USD/CNY dips to hit three year low,scope for further downside
  FxWirePro: USD/CAD retreats after Canada posts stronger-than-expected GDP growth
  US Magnificent 7 Stocks Trend Score: Amazon & Microsoft Hit Extreme Bullish (+100) as Meta Drops to -100 — Key Resistance & Support Watchlist
  Major European Indices Score Extremely Bullish: DAX Eyes 26000, CAC Targets 8600, FTSE100 at 11000 – Key Levels to Watch
  FxWirePro: GBP/NZD remains weak, eyes 38.2%fib support
  FxWirePro: NZD/USD consolidates overnight gains, but loses momentum
  AUD/JPY Slips Below 112 as BOJ Intervention Sparks Bearish Momentum: Sell the Rallies
  FxWirePro: AUD/USD gains some ground but outlook is bearish
  FxWirePro- Woodies pivot (Major)
  Major FX Action Bias & US Market Sentiment: NZD/USD (Extremely Bullish) & AUD/USD (Bullish) Watchlist
  FxWirePro: GBP/USD rises as soft US data pressures dollar
  FxWirePro- Woodies pivot (Major)
  JPY Currency Meter Signals: NZDJPY Bullish (+25) vs CHFJPY (-100) – These Pairs Could Move Next
  NZDJPY Retreats on Yen Strength – Bearish Setup Targets 90 After Hitting 92.75 Low


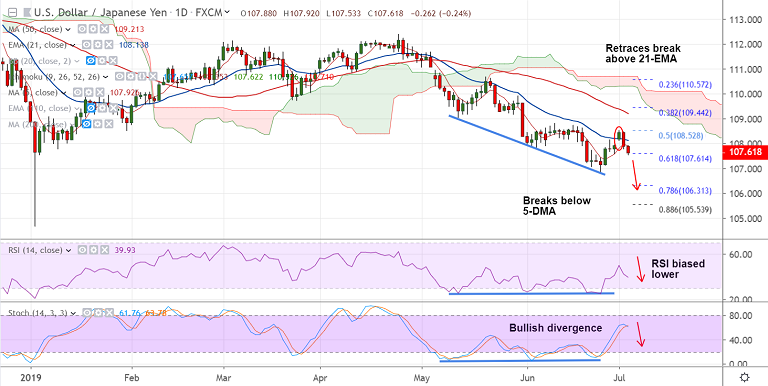
USD/JPY chart - Trading View
USD/JPY extends weakness for the 2nd straight session, slips below 108 handle.
The major was trading 0.26% lower on the day at 107.59 at 04:30 GMT.
Price action failed to hold break above 21-EMA, dips below 5-DMA support.
Renewed US-China trade concerns-led risk-aversion, supporting the safe-haven yen.
While, US Treasury yields trading at the lowest level since Nov 2016 weigh on the Greenback.
The pair has breached below 200H SMA and technical indicators on the intraday charts are turning bearish.
Major trend is bearish and break below 61.8% Fib will see weakness. Next major support lies at 107 (lower BB) ahead of 106.31 (78.6% Fib).
Support levels - 107 (Lower BB), 106.31 (78.6% Fib), 106
Resistance levels - 107.92 (5-DMA), 108.13 (21-EMA), 108.52 (50% Fib)
For details on FxWirePro's Currency Strength Index, visit http://www.fxwirepro.com/currencyindex.


