


 NZDJPY Bullish Rebound: Buy Dips as EMAs Align for 97 Target
  FxWirePro: AUD/USD gains some ground but outlook is bearish
  US Magnificent 7 Stocks Trend Score: Amazon & Microsoft Hit Extreme Bullish (+100) as Meta Drops to -100 — Key Resistance & Support Watchlist
  JPY Currency Meter Signals: NZDJPY Bullish (+25) vs CHFJPY (-100) – These Pairs Could Move Next
  NZDJPY Retreats on Yen Strength – Bearish Setup Targets 90 After Hitting 92.75 Low
  FxWirePro: NZD/USD consolidates overnight gains, but loses momentum
  FxWirePro- Major Crypto levels and bias summary
  AUDJPY Volatile After Massive Sell-Off: Sell Rallies at 113, Targeting 110 as Bearish Momentum Surges
  FxWirePro- Woodies pivot (Major)
  Major European Indices Score Extremely Bullish: DAX Eyes 26000, CAC Targets 8600, FTSE100 at 11000 – Key Levels to Watch
  FxWirePro:USD/JPY climbs back above 160.00 after BOJ rate decision
  AUD/JPY Slips Below 112 as BOJ Intervention Sparks Bearish Momentum: Sell the Rallies
  FxWirePro: USD/CNY dips to hit three year low,scope for further downside
  FxWirePro: GBP/NZD remains weak, eyes 38.2%fib support
  FxWirePro- Major Pair levels and bias summary
  FxWirePro: GBP/NZD remains weak, eyes 38.2%fib support


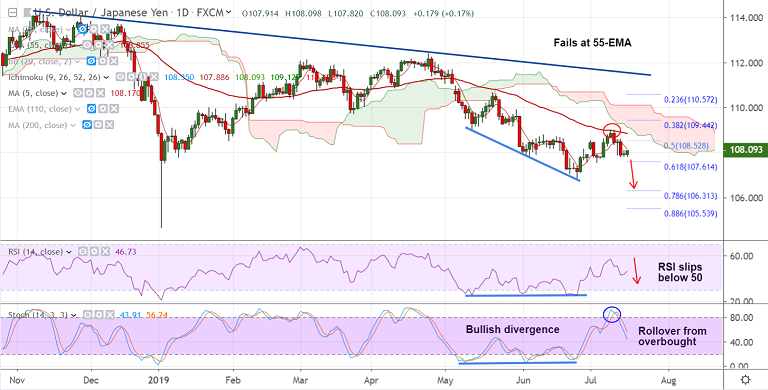
USD/JPY chart - Trading View
USD/JPY is extending sideways grind for the second straight session, bias remains bearish.
The pair hovers around 20-DMA (107.96), finds stiff resistance at 21-EMA at 108.21.
Technical indicators support weakness in the pair. Major trend remains bearish.
5-DMA is sharply lower and Stochastics RSI is showing rollover from over overbought levels.
RSI below 50 and Stochs are sharply lower. Recovery was rejected at 55-EMA.
Scope for weakness till 106.78. Break below will see further downside.
Break above 21-EMA will see minor upside. Bearish invalidation only above daily cloud.
Focus on U.S. June retail sales report due at 12:30 GMT, along with terms of trade and industrial production report due at 13:15 GMT.
Support levels - 107.61 (61.8% Fib), 107, 106.78 (June 25 low)
Resistance levels - 108.16 (5-DMA), 108.21 (21-EMA), 108.85 (55-EMA)
For details on FxWirePro's Currency Strength Index, visit http://www.fxwirepro.com/currencyindex.


