


 FxWirePro- Major Crypto levels and bias summary
  FxWirePro- Woodies pivot (Major)
  FxWirePro:USD/JPY climbs back above 160.00 after BOJ rate decision
  FxWirePro: NZD/USD consolidates overnight gains, but loses momentum
  FxWirePro: GBP/AUD bears maintain upper hand
  Major European Indices Score Extremely Bullish: DAX Eyes 26000, CAC Targets 8600, FTSE100 at 11000 – Key Levels to Watch
  FxWirePro: GBP/NZD remains weak, eyes 38.2%fib support
  FxWirePro- Woodies pivot (Major)
  FxWirePro: GBP/USD rises as soft US data pressures dollar
  FxWirePro: USD/CNY dips to hit three year low,scope for further downside
  FxWirePro- Major Pair levels and bias summary
  FxWirePro: GBP/NZD remains weak, eyes 38.2%fib support
  FxWirePro: EUR/ AUD dips below 1.6400 level, focus on near term support
  FxWirePro: AUD/USD gains some ground but outlook is bearish
  JPY Currency Meter Signals: NZDJPY Bullish (+25) vs CHFJPY (-100) – These Pairs Could Move Next
  FxWirePro- Major Pair levels and bias summary


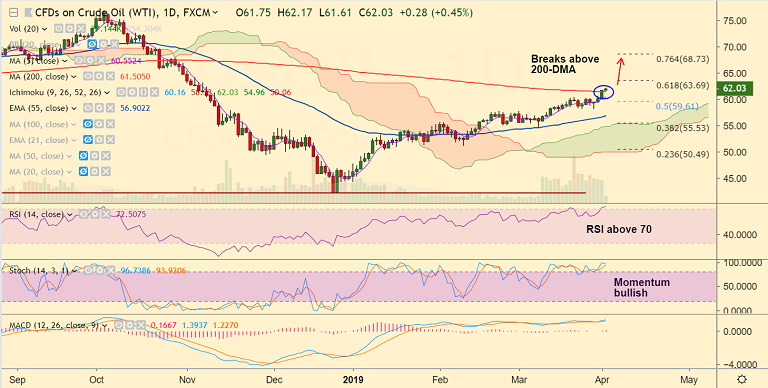
U.S. oil chart - Trading View
- U.S. oil hits 21-week highs at 62.17 before paring some gains to hover around 62 mark at 1130 GMT.
- Speculations of the US sanctions on Iran are keeping oil markets supported.
- Price has breached the 200-day simple moving average (SMA) for the first time since October 2018.
- Oscillators are at highly overbought levels, but we do not see major signs of reversal.
- Scope for test of 61.8% Fib at 63.69. Retrace below 200-DMA could see test of 5-DMA at 60.53.
Support levels - 61.50 (200-DMA), 60.52 (5-DMA), 59.61 (50% Fib)
Resistance levels - 62.55 (Upper BB - weekly), 63, 63.69 (61.8% Fib)
For details on FxWirePro's Currency Strength Index, visit http://www.fxwirepro.com/currencyindex.







