


 FxWirePro- Major Crypto levels and bias summary
  Major Pair Currency Score: NZD/USD and AUD/USD Lead Forex Rally with Perfect 100 Scores
  FxWirePro: AUD/USD eases as investors await U.S. employment figures
  FxWirePro: GBP/AUD under pressure after disappointing U.S. employment data
  FxWirePro: GBP/USD rises as weak U.S. jobs data pressures dollar
  FxWirePro: GBP/USD eases as dollar firms ahead of U.S. June non-farm payrolls report
  FxWirePro: GBP/AUD eases slightly, focus on near-term support
  FxWirePro: EUR/AUD slips after surprise U.S. employment data
  EUR/USD Rockets Past 1.1560 as Soft U.S. Jobs Data Fuel Fed Rate-Cut Surge
  FxWirePro- Major Pair levels and bias summary
  FxWirePro: EUR/ AUD neutral in the near term, scope further downside
  AUDJPY Bears Poised: Sell Rallies at 111.55 for 108 Target with 112.20 Stop
  FxWirePro- Major Pair levels and bias summary
  FxWirePro : USD/CAD falls as strong Canadian jobs data lifts loonie


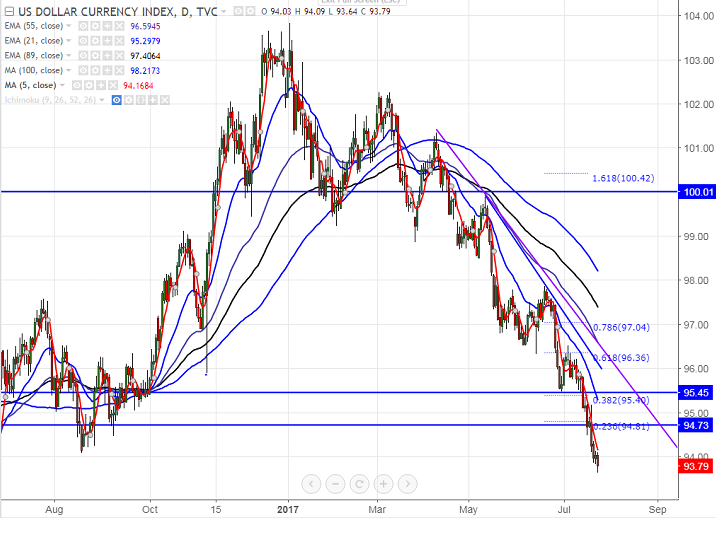
- U.S dollar index has broken major support of 93.85 low made on Jul 21st 2017 low and declined till 93.64 at the time of writing. It is currently trading around 93.79.
- In the daily chart, index upside capped by 10- day MA at 94.92 and any break above will take the DXY till 95.44 (21- EMA)/96.69 (55- day EMA).
The minor resistance is around 94.35 (5- day MA).
- On the lower side, any daily close below 94 will drag the index till 93 in the short term.
- Short term bearish invalidation only above 97.87.
It is good to sell on rallies around 94 with SL around 94.60 for the TP of 93.







