


 FxWirePro: NZD/USD consolidates overnight gains, but loses momentum
  FxWirePro- Major Crypto levels and bias summary
  FxWirePro: USD/CNY dips to hit three year low,scope for further downside
  FxWirePro: EUR/ AUD dips below 1.6400 level, focus on near term support
  FxWirePro- Woodies pivot (Major)
  NZDJPY Retreats on Yen Strength – Bearish Setup Targets 90 After Hitting 92.75 Low
  FxWirePro- Major Pair levels and bias summary
  FxWirePro: GBP/AUD drifts lower after BOE rate decision
  FxWirePro: GBP/NZD remains weak, eyes 38.2%fib support
  FxWirePro:USD/JPY climbs back above 160.00 after BOJ rate decision
  FxWirePro: GBP/USD rises as soft US data pressures dollar
  JPY Currency Meter Signals: NZDJPY Bullish (+25) vs CHFJPY (-100) – These Pairs Could Move Next
  FxWirePro: AUD/USD gains some ground but outlook is bearish
  AUD/JPY Slips Below 112 as BOJ Intervention Sparks Bearish Momentum: Sell the Rallies
  FxWirePro- Major Crypto levels and bias summary
  FxWirePro: USD/ZAR gains as stronger dollar outweighs upbeat South Africa's trade surplus


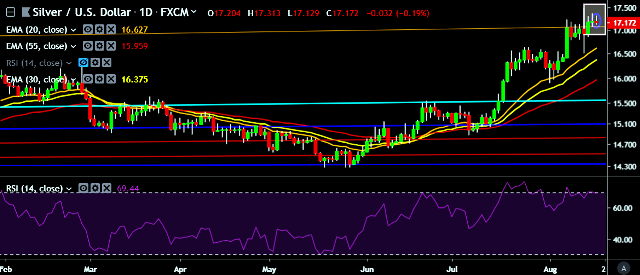
- XAG/USD is currently trading around $17.17 marks.
- It made intraday high at $17.31 and low at $17.12 levels.
- Intraday bias remains bullish till the time pair holds key support at $17.07 mark.
- A daily close above $17.20 will test key resistances at $17.37, $17.48 and $17.78 marks respectively.
- On the other side, a daily close below $17.20 will take the parity down towards key supports at $17.07, $16.87, $16.57, $16.07, $15.90, $15.70, $15.47 and $15.40 marks respectively.
- Important to note here that 20D, 30D and 55D EMA heads up and confirms the bullish trend in a daily chart.
We prefer to take long position on XAG/USD around $17.15, top loss at $17.05 and target of $17.37/$17.48.


