


 FxWirePro: GBP/AUD drifts lower after BOE rate decision
  US Magnificent 7 Stocks Trend Score: Amazon & Microsoft Hit Extreme Bullish (+100) as Meta Drops to -100 — Key Resistance & Support Watchlist
  FxWirePro: GBP/NZD remains weak, eyes 38.2%fib support
  FxWirePro: USD/CAD retreats after Canada posts stronger-than-expected GDP growth
  FxWirePro- Major Pair levels and bias summary
  AUD/JPY Slips Below 112 as BOJ Intervention Sparks Bearish Momentum: Sell the Rallies
  Major FX Action Bias & US Market Sentiment: NZD/USD (Extremely Bullish) & AUD/USD (Bullish) Watchlist
  NZDJPY Bullish Rebound: Buy Dips as EMAs Align for 97 Target
  Nikkei Surges Past 65,000 on Suspected Yen Weakness: Tech Giants Like Advantest and NEC Lead Explosive Gains
  NZDJPY Retreats on Yen Strength – Bearish Setup Targets 90 After Hitting 92.75 Low
  FxWirePro- Major Pair levels and bias summary
  FxWirePro: AUD/USD gains some ground but outlook is bearish
  FxWirePro: EUR/ AUD dips below 1.6400 level, focus on near term support
  FxWirePro- Major Crypto levels and bias summary
  Major European Indices Score Extremely Bullish: DAX Eyes 26000, CAC Targets 8600, FTSE100 at 11000 – Key Levels to Watch
  AUDJPY Volatile After Massive Sell-Off: Sell Rallies at 113, Targeting 110 as Bearish Momentum Surges
  FxWirePro: NZD/USD consolidates overnight gains, but loses momentum


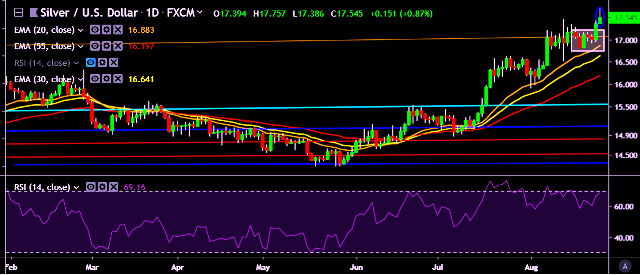
- XAG/USD is currently trading around $17.53 marks.
- It made intraday high at $17.75 and low at $17.38 levels.
- Intraday bias remains bullish for the moment.
- A daily close above $17.40 will test key resistances at $17.75, $17.98, $18.07, $18.18 marks respectively.
- On the other side, a daily close below $17.40 will take the parity down towards key supports at $17.02, $16.70, $16.57, $16.07, $15.90, $15.70, $15.47 and $15.40 marks respectively.
- Important to note here that 20D, 30D and 55D EMA heads up and confirms the bullish trend in a daily chart.
We prefer to take long position on XAG/USD around $17.47, stop loss at $16.38 and target of $17.75/$17.98.


