


 SpaceX Stock Gets $175 Target as Analysts See Massive Growth Ahead
  Gold Prices Slide as Rate Cut Prospects Diminish; Copper Gains on China Stimulus Hopes
  World Cup technology: from ref cams to AI analysts, cutting-edge research is changing the game
  Oil Prices Dip Slightly Amid Focus on Russian Sanctions and U.S. Inflation Data
  China's Refining Industry Faces Major Shakeup Amid Challenges
  J.P. Morgan Sees Potential Vestas Guidance Upgrade Amid Strong Wind Energy Demand
  Lithium Market Poised for Recovery Amid Supply Cuts and Rising Demand
  European Stocks Rally on Chinese Growth and Mining Merger Speculation
  Moldova Criticizes Russia Amid Transdniestria Energy Crisis
  China’s AI Manufacturing Boom Masks Weak Consumer Economy, Citi Says
  With Iran and the US signing a peace deal, where does that leave Benjamin Netanyahu?
  Fed May Resume Rate Hikes: BofA Analysts Outline Key Scenarios


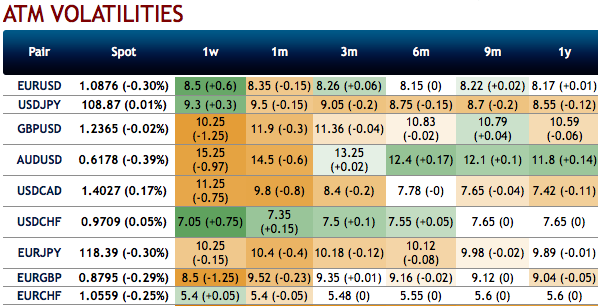
The bazookas of fiscal and monetary programs alleviated some of the vol pain over the past week. Option risk premium is getting squeezed from one side by the softening implied vol and from the other by a floor under the realized vol as the risk on/off sentiment flip-flopping is generating spot gyrations. A proxy estimate points to a VXY-GL exponentially weighted average of realized vol to be hovering >2pts above the 3M ATM vols counterpart. You can observe this in above nutshell (1st exhibit) evidencing implied vols of G10 FX-bloc, wherein, the laggards are coming out of the low IV surface that lasted longer in 2019.
Pricing of vega tenors promptly reverted lower following last week’s turn in sentiment leading to 1M – 6M ATM spread being near the widest since the GFC. The stark material disparity of pricing of COVID-19 uncertainty further out on the vol curve suggest that markets are expecting a quick resolution. While not discounting the possibility that we’ve seen the bottom, we are doubtful that the current episode will follow the “short-lived high-vol” blueprint of the past few years in a monotonic fashion, and we think that the vol curves are dislocated.
We utilize a tactical Gamma indicator (e.g. see Total-return version of tactical filter allowing long Gamma trades), to gain insight on the possible timing of a recovery from the current high-volatility markets.
We test the application of the filter to a fast moving proxy risk-on asset (S&P in this case) to check the typical lag the indicator has historically exhibited after the market bottoms and starts to turn around. Statistical properties of the FX tactical indicator during the longest risk-off/long-Gamma streaks is given in the 2ndexhibit.
The methodology in itself is based on short-dated estimates of trends for risk-related variables; therefore, it naturally lags market dynamics both at the onset and at the end of a risk-off period. On the previous occasions when the time lag of the indicator was longer than the current one (7 days), the underlying tended to suffer a second dip after rising from the bottom. In terms of % recovery missed by staying too long in risk-off territory, the 7 day lag would correspond to 3-14%.
At 19 consecutive days, the current long-Gamma streak is the third longest over the period considered. It trails only the GFC (when long Gamma held for 35 consecutive days) and the early signs of credit distress in 2007 (23 days). The highest value on record, i.e., historically the strongest long- Gamma signal at around 75%, was reached on March 24.
The current value of the indicator (+62% vs. the max of +75%) is still well within the risk-aversion area, keeping us defensive and prompting us to limit our downside when harvesting risk premium.
Historically wide AUD and to large degree CAD skews are best faded via 1*1 vol ratio spreads, as gamma filtering suggests.
DNTs can allow fading elevated vol premia at defined downside while also yielding attractive risk/reward profiles. EURJPY tops the list thanks to the sharp rebound in implied vols even as spot remained in a tight 5% range over the past 10 months.
The vol curves suggest a quick resolve but we are doubtful that we are out of the woods just yet and find back-end USDINR and USDJPY forward vols to be attractive to own. Courtesy: JPM


