


 FxWirePro: AUD/USD uptrend loses steam, remains on bearish path
  FxWirePro- Major Crypto levels and bias summary
  FxWirePro :USD/JPY eases slightly, remains on bullish path
  FxWirePro:USD/JPY hovers near a four-decade low
  FxWirePro: EUR/NZD firms after ECB holds rates steady at 2.25%
  NZDJPY Action Bias: Bullish Dip-Buying Opportunity on Broad Yen Weakness
  FxWirePro: GBP/NZD downside pressure builds, key support levels in focus
  JPY Action Bias: USDJPY, EURJPY, and CADJPY Emerge as Top Extremely Bullish Picks
  FxWirePro: USD/CAD positions for another climb, eyes 1.4150 level
  FxWirePro: NZD/USD gains as U.S.-Iran peace hopes boost risk sentiment
  FxWirePro: USD/CAD edges lower but bullish outlook persists
  FxWirePro- Major Pair levels and bias summary
  NZDJPY Bullish Dip-Buy Setup: 93.60 Support Unlocks Path to 97
  FxWirePro: GBP/NZD gains some ground but outlook is bearish
  JPY Action Bias: Bullish Pairs to Watch Out For
  AUDJPY Extends Four-Day Rally on Yen Weakness: Bullish Dip-Buy Eyes 117-118
  BTC, ETH, SOL, XRP, and BNB: Major Crypto Pairs Stay Neutral


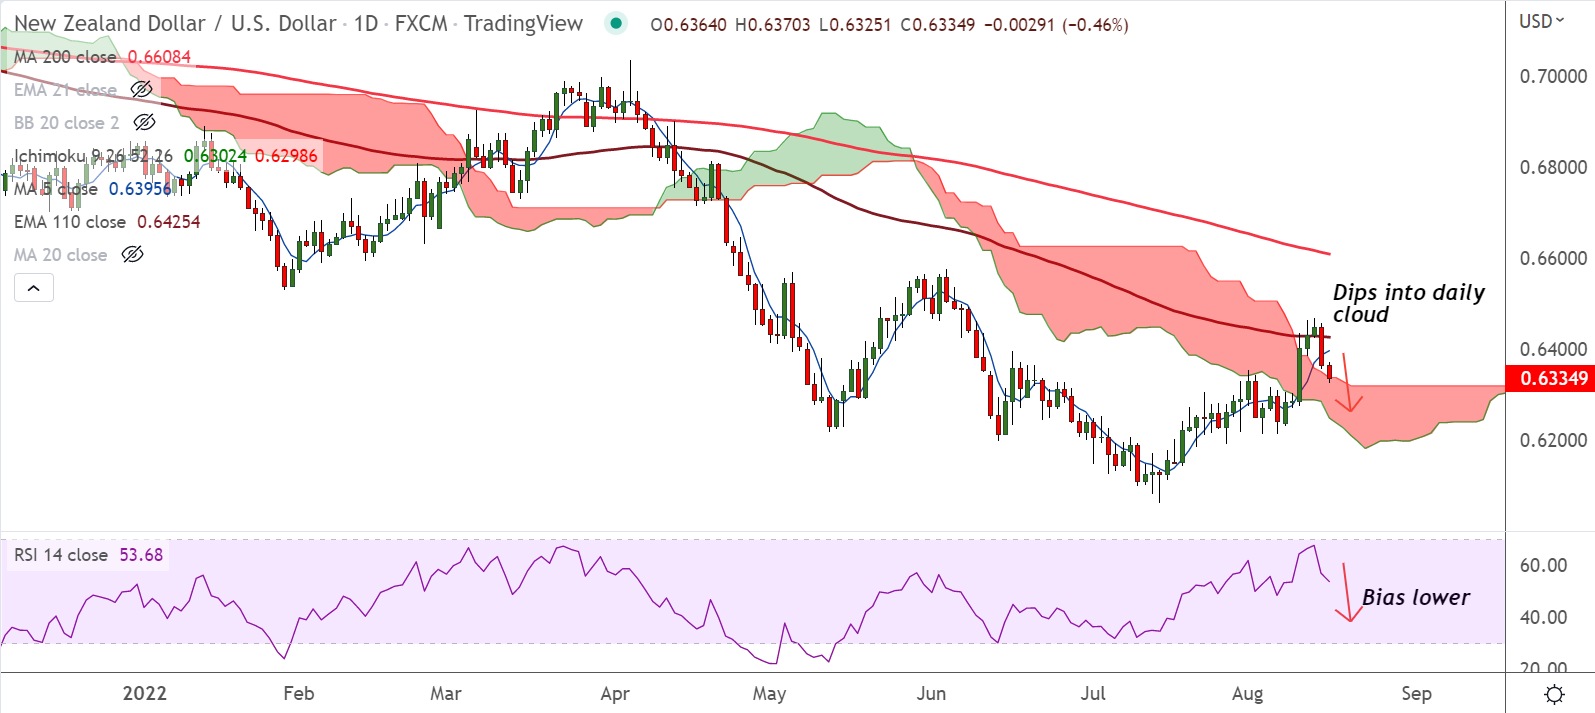
Chart - Courtesy Trading View
Technical Analysis:
- NZD/USD was trading 0.56% lower on the day at 0.6328 at around 07:20 GMT
- The pair has dipped into daily cloud, raising scope for further downside
- Price action has failed to hold break above 110-EMA, has slipped below 200H MA
- GMMA indicator shows major and minor trend have turned bearish on the intraday charts
- Momentum is turning bearish. RSI is biased lower and Stochs are on verge of bearish rollover from overbought levels
Support levels:
S1: 0.6307 (21-EMA)
S2: 0.6264 (50-DMA)
Resistance levels:
R1: 0.6341 (200H MA)
R2: 0.6394 (5-DMA)
Summary: NZD/USD is extending weakness for the second consecutive session. Break below cloud top has raised scope for more weakness. Dip till 50-DMA at 0.6264 likely. Hawkish FOMC minutes will add downside pressure on the pair.


