


 NZDJPY Bullish Rebound: Buy Dips as EMAs Align for 97 Target
  US Magnificent 7 Stocks Trend Score: Amazon & Microsoft Hit Extreme Bullish (+100) as Meta Drops to -100 — Key Resistance & Support Watchlist
  Nikkei Surges Past 65,000 on Suspected Yen Weakness: Tech Giants Like Advantest and NEC Lead Explosive Gains
  US Magnificent 7 Stocks Trend Score: Amazon & Microsoft Hit Extreme Bullish (+100) as Meta Drops to -100 — Key Resistance & Support Watchlist
  AUD/JPY Slips Below 112 as BOJ Intervention Sparks Bearish Momentum: Sell the Rallies
  AUDJPY Volatile After Massive Sell-Off: Sell Rallies at 113, Targeting 110 as Bearish Momentum Surges
  FxWirePro- Major Crypto levels and bias summary
  FxWirePro: GBP/NZD remains weak, eyes 38.2%fib support
  FxWirePro: USD/CAD retreats after Canada posts stronger-than-expected GDP growth
  FxWirePro- Woodies pivot (Major)
  FxWirePro: GBP/AUD bears maintain upper hand
  FxWirePro: GBP/USD rises as soft US data pressures dollar
  FxWirePro: USD/ZAR gains as stronger dollar outweighs upbeat South Africa's trade surplus
  FxWirePro:USD/JPY climbs back above 160.00 after BOJ rate decision
  FxWirePro: AUD/USD gains some ground but outlook is bearish


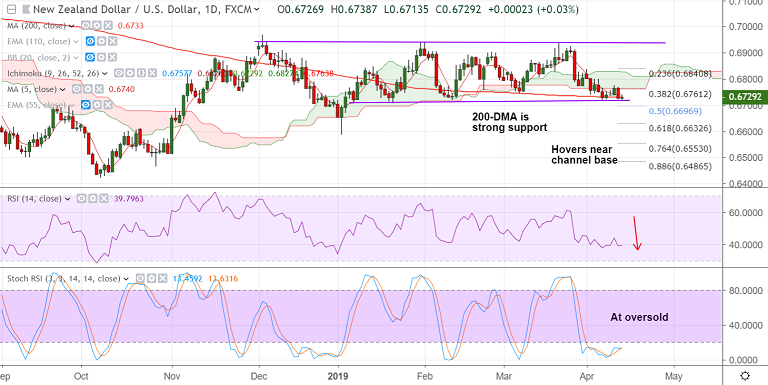
NZD/USD chart - Trading View
- NZD/USD is trading in a narrow range, hit session highs at 0.6738 and lows at 0.6713.
- The pair was rejected at daily cloud and has slipped below 200-DMA.
- The pair weakened overnight after upbeat U.S. PPI and jobs data buoyed USD across the board.
- Price action hovers around channel base support at 0.6715. Break below will see extension of downside.
- Technical studies support bearish bias. Break below channel base will likely see test of 61.8% Fib at 0.6632.
- Focus now on China Trade Balance data for further impetus. Bearish invalidation above daily cloud.
Support levels - 0.6715 (channel base), 0.6696 (50% Fib), 0.6632 (61.8% Fib)
Resistance levels - 0.6733 (200-DMA), 0.6741 (5-DMA), 0.6763 (nearly converged cloud base and 38.2% Fib)
Recommendation: Watch out for breach of channel support to go short.
For details on FxWirePro's Currency Strength Index, visit http://www.fxwirepro.com/currencyindex.


