


 FxWirePro: GBP/USD rises as soft US data pressures dollar
  FxWirePro- Woodies pivot (Major)
  US Magnificent 7 Stocks Trend Score: Amazon & Microsoft Hit Extreme Bullish (+100) as Meta Drops to -100 — Key Resistance & Support Watchlist
  NZDJPY Retreats on Yen Strength – Bearish Setup Targets 90 After Hitting 92.75 Low
  FxWirePro- Major Crypto levels and bias summary
  FxWirePro: GBP/NZD remains weak, eyes 38.2%fib support
  FxWirePro: EUR/ AUD dips below 1.6400 level, focus on near term support
  FxWirePro- Major Pair levels and bias summary
  FxWirePro- Major Pair levels and bias summary
  FxWirePro: GBP/AUD bears maintain upper hand
  FxWirePro: GBP/NZD remains weak, eyes 38.2%fib support
  JPY Currency Meter Signals: NZDJPY Bullish (+25) vs CHFJPY (-100) – These Pairs Could Move Next
  AUDJPY Volatile After Massive Sell-Off: Sell Rallies at 113, Targeting 110 as Bearish Momentum Surges
  FxWirePro: USD/ZAR gains as stronger dollar outweighs upbeat South Africa's trade surplus
  AUD/JPY Slips Below 112 as BOJ Intervention Sparks Bearish Momentum: Sell the Rallies


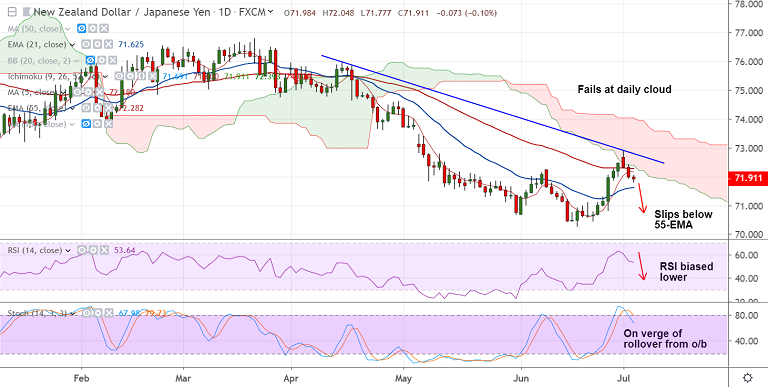
NZD/JPY chart - Trading View
NZD/JPY fails to extend break above cloud base, edges lower from 8-week highs at 72.93.
The pair has slipped below 55-EMA and 5-DMA supports, scope for further downside.
RSI has turned and Stochs are on verge of rollover from overbought levels.
Strong support seen till 71.40, break below will see further downside.
Price action has paused 2 straight weeks of gains. Retrace till 70.26 (June 18 low) likely.
Major trend has been bearish and we see bearish invalidation only above cloud.
Support levels - 71.62 (21-EMA), 71. 70.26 (June 18 low)
Resistance levels - 72.17 (5-DMA), 72.93 (July 1st high), 73.22 (110-EMA)
For details on FxWirePro's Currency Strength Index, visit http://www.fxwirepro.com/currencyindex.


