


 Major European Indices Score Extremely Bullish: DAX Eyes 26000, CAC Targets 8600, FTSE100 at 11000 – Key Levels to Watch
  FxWirePro:USD/JPY climbs back above 160.00 after BOJ rate decision
  FxWirePro: USD/ZAR gains as stronger dollar outweighs upbeat South Africa's trade surplus
  US Magnificent 7 Stocks Trend Score: Amazon & Microsoft Hit Extreme Bullish (+100) as Meta Drops to -100 — Key Resistance & Support Watchlist
  FxWirePro- Woodies pivot (Major)
  Nikkei Surges Past 65,000 on Suspected Yen Weakness: Tech Giants Like Advantest and NEC Lead Explosive Gains
  NZDJPY Retreats on Yen Strength – Bearish Setup Targets 90 After Hitting 92.75 Low
  FxWirePro- Major Pair levels and bias summary
  AUD/JPY Slips Below 112 as BOJ Intervention Sparks Bearish Momentum: Sell the Rallies
  US Magnificent 7 Stocks Trend Score: Amazon & Microsoft Hit Extreme Bullish (+100) as Meta Drops to -100 — Key Resistance & Support Watchlist
  Major FX Action Bias & US Market Sentiment: NZD/USD (Extremely Bullish) & AUD/USD (Bullish) Watchlist
  FxWirePro: AUD/USD gains some ground but outlook is bearish
  NZDJPY Bullish Rebound: Buy Dips as EMAs Align for 97 Target
  FxWirePro: EUR/ AUD dips below 1.6400 level, focus on near term support
  JPY Currency Meter Signals: NZDJPY Bullish (+25) vs CHFJPY (-100) – These Pairs Could Move Next


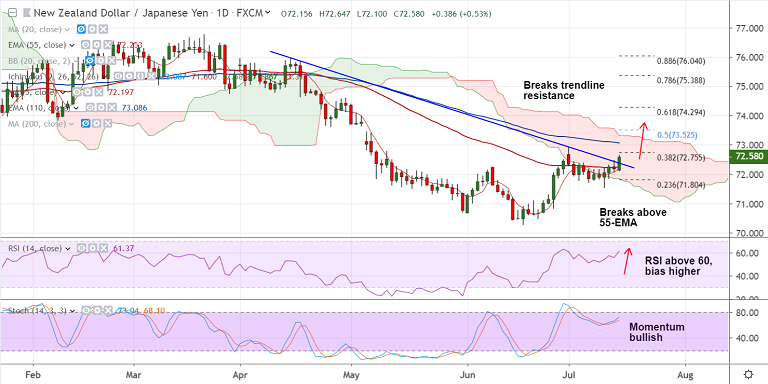
NZD/JPY chart - Trading View
NZD/JPY trades 0.54% higher on the day at 72.58 at 07:25 GMT, bias higher.
The pair has resumed upside after brief consolidation below 55-EMA.
Price action has broken above 55-EMA and is extending gains above cloud base.
Stochs and RSI are biased higher and 5-DMA has turned. RSI is above 50 and shows strength in the current uptrend.
The pair has also broken strong trendline resistance at 72.40 and is on track to test 110-EMA at 73.08.
Failure to hold above 55-EMA could see extension of sideways trade. Break above 110-EMA required for further upside.
Support levels - 72.25 (55-EMA), 72, 71.86 (cloud base)
Resistance levels - 72.93 (July 1 high), 73.08 (110-EMA), 73.31 (cloud top)
Recommendation: Good to go long on dips, SL: 72.15, TP: 72.90/ 73.30
For details on FxWirePro's Currency Strength Index, visit http://www.fxwirepro.com/currencyindex.


