


 China's Refining Industry Faces Major Shakeup Amid Challenges
  FxWirePro: GBP/AUD drifts lower after BOE rate decision
  FxWirePro: GBP/NZD remains weak, eyes 38.2%fib support
  Gold Prices Fall Amid Rate Jitters; Copper Steady as China Stimulus Eyed
  UBS Projects Mixed Market Outlook for 2025 Amid Trump Policy Uncertainty
  FxWirePro: USD/CNY dips to hit three year low,scope for further downside
  Energy Sector Outlook 2025: AI's Role and Market Dynamics
  U.S. Banks Report Strong Q4 Profits Amid Investment Banking Surge
  Indonesia Surprises Markets with Interest Rate Cut Amid Currency Pressure
  FxWirePro: NZD/USD consolidates overnight gains, but loses momentum
  NZDJPY Retreats on Yen Strength – Bearish Setup Targets 90 After Hitting 92.75 Low
  Lithium Market Poised for Recovery Amid Supply Cuts and Rising Demand
  Goldman Predicts 50% Odds of 10% U.S. Tariff on Copper by Q1 Close
  FxWirePro: GBP/NZD remains weak, eyes 38.2%fib support
  All Major JPY Pairs Hit Extreme Bearish Score of -100: USDJPY, EURJPY, GBPJPY, AUDJPY, NZDJPY & CADJPY Flash Maximum Weakness
  Gold Prices Slide as Rate Cut Prospects Diminish; Copper Gains on China Stimulus Hopes
  European Stocks Rally on Chinese Growth and Mining Merger Speculation


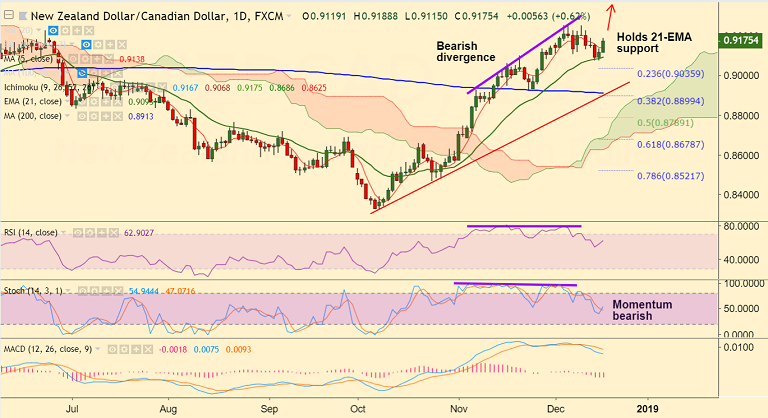
NZD/CAD chart on Trading View used for analysis
FxWirePro Currency Strength Index for NZD/CAD: Bias Bullish
FxWirePro's Hourly NZD Spot Index was at 100.667 (Bullish)
FxWirePro's Hourly CAD Spot Index was at -94.7994 (Bearish)
Technical Analysis: Bias Bullish
- Bounces off 21-EMA support, extends gains for the 2nd straight session
- Price action above cloud and major moving averages
- Breaks above 5-DMA at 0.9139
- Breaks above 1H 200 SMA, intraday charts are biased higher
Fundamental Factors:
- New Zealand Q3 GDP figures (due Wed) will drive price action if there is any significant surprise. Markets expect Q3 GDP to edge lower to 0.6% from 1.0% in the previous quarter.
- Focus also on Bank of Canada's (BoC) Consumer Price Index due Wednesday for further direction.
Support levels - 0.9139 (5-DMA), 0.9093 (21-EMA), 0.8982 (May 2 low)
Resistance levels - 0.9227 (Jun 22 high), 0.9251 (Dec 5, 11 high), 0.9275 (Apr 18 high)
Recommendation: Good to go long on dips around 0.9170, SL: 0.9135, TP: 0.92/ 0.9225/ 0.9250
For more details on FxWirePro's Currency Strength Index, visit http://www.fxwirepro.com/currencyindex.

- News

- Economy

- Central Banks
- Investing
- Research
- Roundups
- Digital Currency
- Insights
- Technical Analysis
- Technology
- Business
- Law
- Health
- Nature
- Fintech
- Science
- Topic
- Opinions
- ©Econometrics LLC . All Rights Reserved.
FxWirePro: NZD/CAD Trade Idea
Tuesday, December 18, 2018 4:20 AM UTC
Editor's Picks


- Market Data
Most Popular


