


 FxWirePro: USD/CNY edges higher but bulls lack punch
  FxWirePro- Woodies pivot (Major)
  FxWirePro: USD/CAD positions for another climb, eyes 1.4150 level
  Major Pairs Action Bias: USDCHF Emerges Extremely Bullish as EURUSD and GBPUSD Turn Deeply Bearish
  FxWirePro: EUR/NZD firms after ECB holds rates steady at 2.25%
  FxWirePro: GBP/USD downtrend loses steam but outlook still bearish
  AUDJPY Extends Four-Day Rally on Yen Weakness: Bullish Dip-Buy Eyes 117-118
  Crypto Bias Report: Trend Signals and Top Bullish Picks
  FxWirePro- Major Pair levels and bias summary
  FxWirePro- Woodies pivot (Major)
  FxWirePro: GBP/NZD downside pressure builds, key support levels in focus
  BTC, ETH, SOL, XRP, and BNB: Major Crypto Pairs Stay Neutral
  NZDJPY Bullish Dip-Buy Setup: 93.60 Support Unlocks Path to 97
  FxWirePro:USD/JPY hovers near a four-decade low
  FxWirePro: AUD/USD uptrend loses steam, remains on bearish path


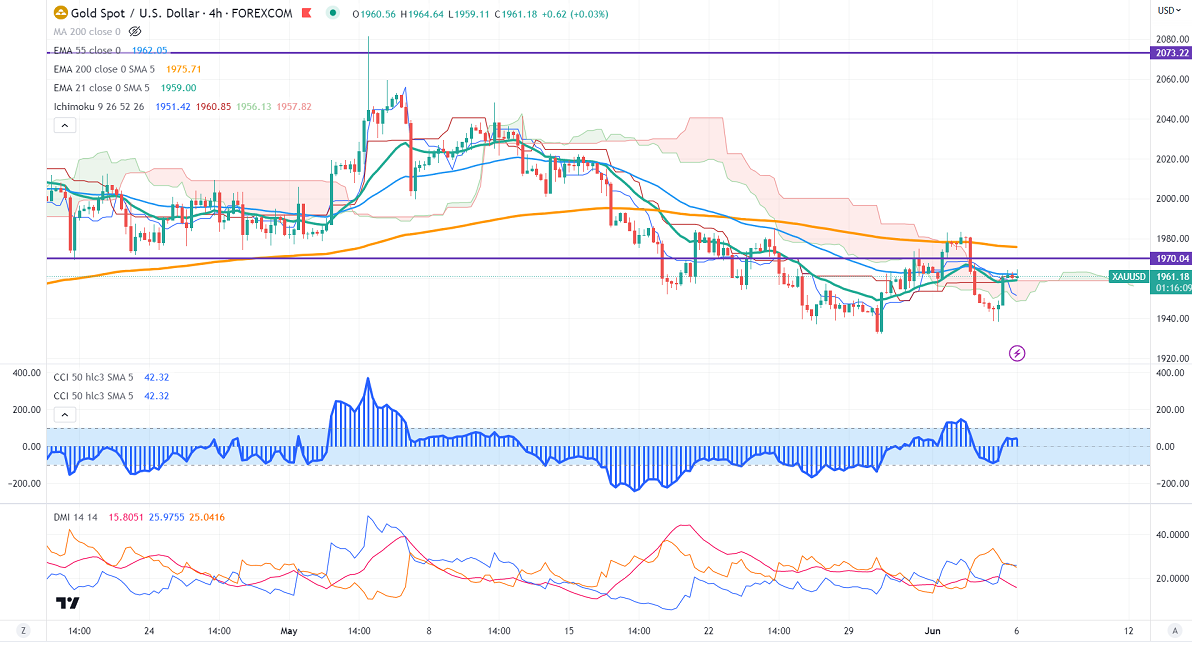
Ichimoku Analysis (4-Hour chart)
Tenken-Sen- $1952.76
Kijun-Sen- $1960.85
Gold prices showed a minor pullback on easing the US dollar. The US dollar index lost momentum after weak US ISM services PMI. It hits an intraday high of $1964.64 and is currently trading around $1959.31.
US ISM services PMI came at 50.30 in May, below the estimate of 52.60.
US dollar index- Bullish. Minor support around 102.30/101.50. The near-term resistance is 104.40/105.
According to the CME Fed watch tool, the probability of a no-rate hike in June increased to 77% from 35.80% a week ago.
The US 10-year yield pared some of its gains on weak economic data. The US 10 and 2-year spread narrowed to -79.40% from -108%.
Factors to watch for gold price action-
Global stock market- bullish (negative for gold)
US dollar index - Bullish (negative for gold)
US10-year bond yield- Bullish (Bearish for gold)
Technical:
The near–term support is around $1935, a break below targets of $1920/$1900.The yellow metal faces minor resistance around $1965, and a breach above will take it to the next level of $1980/$2000/$2020/$2040/$2070/$2100/$2150.
It is good to sell on rallies around $1980 with SL around $2000 for TP of $1920/$1900.


