


 Bitcoin on Edge: Geopolitical Tensions Weigh on BTC as Bulls Eye the USD 64,000 "Buy the Dip" Zone
  FxWirePro: AUD/USD gains some ground but remains sensitive to Middle East tensions
  FxWirePro: USD/CNY dips as China’s yuan strengthens on Iran war de escalation hopes
  Yen Resurgence Drives GBPJPY to 2.5-Week Low: Sellers Aim for 208.00
  Sterling’s Six-Week Streak Snaps: GBPJPY Slumps Toward 210.00 as Bearish Momentum Intensifies
  FxWirePro- Major European Indices
  Bitcoin Recovers Amid Easing Geopolitics: Bulls Target USD 80,000 Support Rebound
  Dollar Resurgence Propels USDCHF Above 0.8000: Technicals Signal Continued Bullish Momentum Toward 0.8150
  AUDJPY Pullback Intensifies: Resistance at 110.00 Signals Short Opportunity
  Euro Bulls Charge Past 1.1600: Broad Dollar Sell-Off Ignites Powerful EURUSD Rally
  Euro Bulls Retreat: EURUSD Faces Resistance at 1.1500 as Technical Indicators Signal Further Downside
  FxWirePro- Woodies Pivot(Major)
  FxWirePro- Major European Indices
  FxWirePro: EUR/AUD retreats slightly but trend is still bullish
  FxWirePro- Major Pair levels and bias summary
  FxWirePro: GBP/NZD uptrend loses momentum but bullish setup remains


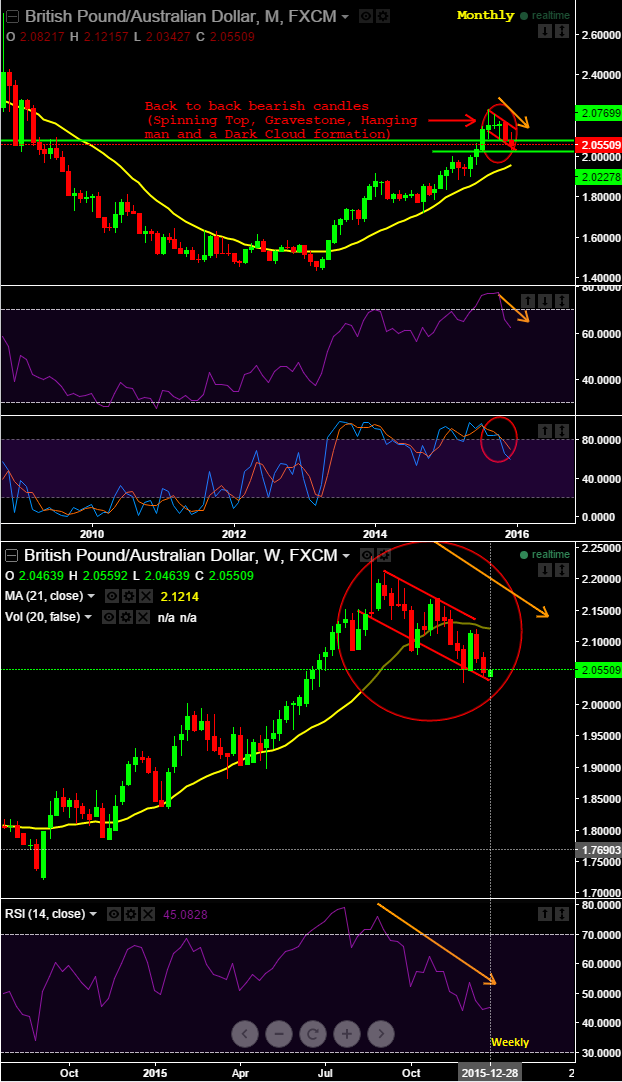
Back to back bearish patterns on monthly graphs: We traced out bearish spinning top, gravestone doji and hanging man patterns at around 2.1549, 2.1552 and 2.1607 levels respectively. These bearish pattern are an extremely helpful for both long term investors and short term traders visually to see where resistance and supply is likely located and you can see their effects on daily price dips.
After an uptrend, the Gravestone Doji can signal to traders that the uptrend could be exhausted and that long positions should probably be exited. These price declines moving in downward channel taking supports at channel base to attempt of recoveries but not beyond channel resistance.
Since we always keep urging not to jump the guns, technicals should not be studied in an isolation. So other indicators should be used in conjunction with these bearish indications to determine an accurate sell signal. A potential trigger could be a break of the upward trendline support with this doji pattern.
Convergence on oscillators: To substantiate the bullish reversal stance, leading oscillators are also converging downwards with current falling price fluctuations; you can figure this out from monthly chart. The current prices have shown their impact of this bearish candle patterns on daily chart. The pair has fallen from the formation of 1st doji at 2.2370, even broken up to 2.0789 levels.
RSI on monthly is currently trending near 62.2002, while %D crossover on slow stochastic still maintains around 70 levels that signify bearish momentum is continuing in long run.
Daily price actions: Daily prices are well below moving average curve. We maintain our bearish stance on this pair as the current spot prices have been well below moving average curve that signals us long term bearish trend is on the cards.
The pair has pretty much responded as per earlier analysis as well and we could now foresee a little bit price bounces in near term as the daily chart suggest some buying interest that would result in some price recoveries but we maintain our target at 2.0380 levels in short run and towards further southern directions up to 2.0030 mark in medium run.

- News

- Economy

- Central Banks
- Investing
- Research
- Roundups
- Digital Currency
- Insights
- Technical Analysis
- Technology
- Business
- Law
- Health
- Nature
- Fintech
- Science
- Topic
- Opinions
- ©Econometrics LLC . All Rights Reserved.
FxWirePro: GBP/AUD bearish swings move in channel, downtrend to prolong in long term despite interim upswings
Monday, December 28, 2015 7:50 AM UTC
Editor's Picks


- Market Data
Most Popular


