


 Gold's 365-Day EMA Streak Since Oct 2023 Faces Its First Real Test at $3,980 — Break or Bounce to $4,140?
  Bank of America Posts Strong Q4 2024 Results, Shares Rise
  2025 Market Outlook: Key January Events to Watch
  Goldman Sachs: US Dollar Likely to Stay Strong Despite Oil Price Retreat
  China's Refining Industry Faces Major Shakeup Amid Challenges
  UBS Predicts Potential Fed Rate Cut Amid Strong US Economic Data
  US Futures Rise as Investors Eye Earnings, Inflation Data, and Wildfire Impacts
  Gold Prices Fall Amid Rate Jitters; Copper Steady as China Stimulus Eyed
  U.S. Banks Report Strong Q4 Profits Amid Investment Banking Surge
  How Donald Trump has changed the way diplomacy is done
  Energy Sector Outlook 2025: AI's Role and Market Dynamics
  S&P 500 Relies on Tech for Growth in Q4 2024, Says Barclays
  J.P. Morgan Sees Potential Vestas Guidance Upgrade Amid Strong Wind Energy Demand


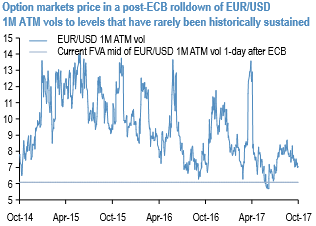
Let’s have a glance through volatility surface in euro crosses before we begin with this write up, 1m EURUSD ATM IVs have been the least among the G7 FX space. IVs of all euro pairs have been considerably shrinking away despite lingering geopolitical issues.
That sinking feeling: Implied and realized volatilities across Europe continue to sink steadily with short-term realized volatility on European indices having touched their lowest ever levels this month (20-day vol below 5%). In this note, we try and explain some drivers of these moves.
Extreme low sector correlation is accelerating the process: One other key market metric at all-time lows is the average pair-wise correlation between sector prices. We break-down the index vol into single stock vol and correlation components (as measured in dispersion). We find evidence that the dispersion of returns between is a key driver of the recent weakness of European index vols. However, it’s also evident that index vol itself is under pressure.
Evidence of gamma saturation from hedging: On most European indices, we find that close-to-close vol has been significantly lower than realized vol calculated on an intraday basis since Q4-2016 – a period that we believe has coincided with the higher selling of vol risk premium. An obvious reason is the hedging flow from market makers (generally done at the close). This is definitive proof of this oft-mentioned large positive gamma positioning and of its impact on vol.
Visualizing the low vol trap: Lower volatility makes the gamma exposure of hedging accounts higher – simply because gamma is defined as the change in delta for a 1% move in the spot. We present simple charts to quantify the effect and explain how it contributes to the low vol trap. We also suggest how to position in such an environment, citing a few examples.
What’s needed to change the situation? Among the two drivers discussed in this note, the extremely low sector correlation seems to be the more temporary one. It’s hard to imagine a 1-month sector correlation below 10% for more than a few weeks. Gamma saturation or the low vol trap, on the other hand, is trickier. Only a real change in the economic environment and fall in profit trends would reduce the pre-eminence of the short vol trade.


