


 NZDJPY Retreats on Yen Strength – Bearish Setup Targets 90 After Hitting 92.75 Low
  FxWirePro: AUD/USD gains some ground but outlook is bearish
  Major FX Action Bias & US Market Sentiment: NZD/USD (Extremely Bullish) & AUD/USD (Bullish) Watchlist
  FxWirePro- Major Crypto levels and bias summary
  FxWirePro:USD/JPY climbs back above 160.00 after BOJ rate decision
  FxWirePro: GBP/AUD drifts lower after BOE rate decision
  FxWirePro- Woodies pivot (Major)
  US Magnificent 7 Stocks Trend Score: Amazon & Microsoft Hit Extreme Bullish (+100) as Meta Drops to -100 — Key Resistance & Support Watchlist
  AUDJPY Volatile After Massive Sell-Off: Sell Rallies at 113, Targeting 110 as Bearish Momentum Surges
  FxWirePro: USD/CAD retreats after Canada posts stronger-than-expected GDP growth
  FxWirePro: GBP/USD rises as soft US data pressures dollar
  FxWirePro: USD/ZAR gains as stronger dollar outweighs upbeat South Africa's trade surplus
  NZDJPY Bullish Rebound: Buy Dips as EMAs Align for 97 Target
  FxWirePro: NZD/USD consolidates overnight gains, but loses momentum
  US Magnificent 7 Stocks Trend Score: Amazon & Microsoft Hit Extreme Bullish (+100) as Meta Drops to -100 — Key Resistance & Support Watchlist


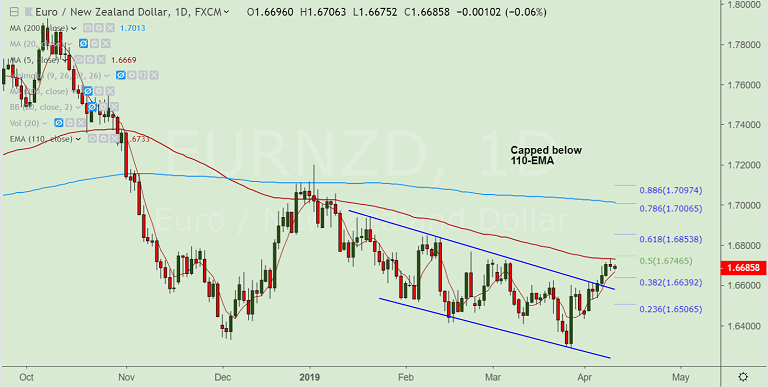
EUR/NZD chart - Trading View
Chart Pattern: Sloping Channel
Candlestick Pattern: Spinning Top
Technical Analysis: Bias Slightly Bullish
- Capped below 110-EMA, spinning top formation at highs
- Price action has broken above channel top
- Holds 5-DMA, 5-DMA is rising
- Stochs are at overbought levels, MACD supports upside
Event Watch: ECB monetary policy meeting
Support levels - 1.6669 (5-DMA), 1.6639 (38.2% Fib), 1.6618 (55-EMA)
Resistance levels - 1.6733 (110-EMA), 1.68, 1.6853 (61.8% Fib)
Currency Forecasts: Breakout at 110-EMA will see gains upto 61.8% Fib at 1.6853
For details on FxWirePro's Currency Strength Index, visit http://www.fxwirepro.com/currencyindex.

- News

- Economy

- Central Banks
- Investing
- Research
- Roundups
- Digital Currency
- Insights
- Technical Analysis
- Technology
- Business
- Law
- Health
- Nature
- Fintech
- Science
- Topic
- Opinions
- ©Econometrics LLC . All Rights Reserved.
FxWirePro: EUR/NZD Daily Technical Outlook
Wednesday, April 10, 2019 6:26 AM UTC
Editor's Picks


- Market Data
Most Popular


