


 FxWirePro: GBP/NZD maintains bersish bias with focus on 2.2900 level
  FxWirePro : GBP/NZD strongly bearish despite upside attempts
  FxWirePro: EUR/ AUD gains some ground , but remains on bearish path
  FxWirePro: USD/ CNY hits one-month low,scope for futher downside
  FxWirePro: USD/ZAR firms ahead of Fed interest rate decision
  FxWirePro: EUR/AUD regains upwards momentum but unable to hold above 50%fib level
  FxWirePro: NZD/USD firms as Kiwi gains on strong ANZ business outlook data
  FxWirePro- Major Crypto levels and bias summary
  FxWirePro: USD/CAD slips after Fed holds rates steady
  FxWirePro:EUR/NZD gains some upside momentum but still bearish
  FxWirePro: AUD/USD dips below lower range, bearish bias increases
  FxWirePro: NZD/USD neutral in the near-term, scope for downward resumption
  Buy the Dips on EUR/JPY: Bullish Structure Points to 188 Target Ahead of Fed
  FxWirePro- Major Pair levels and bias summary
  FxWirePro: USD/CAD runs out of steam but maintains bullish outlook
  JPY Pairs Action Bias: EURJPY Leads as Bullish Standout Amid Mixed Momentum
  JPY Action Bias: EURJPY and CADJPY Emerge as Extremely Bullish Pairs to Watch


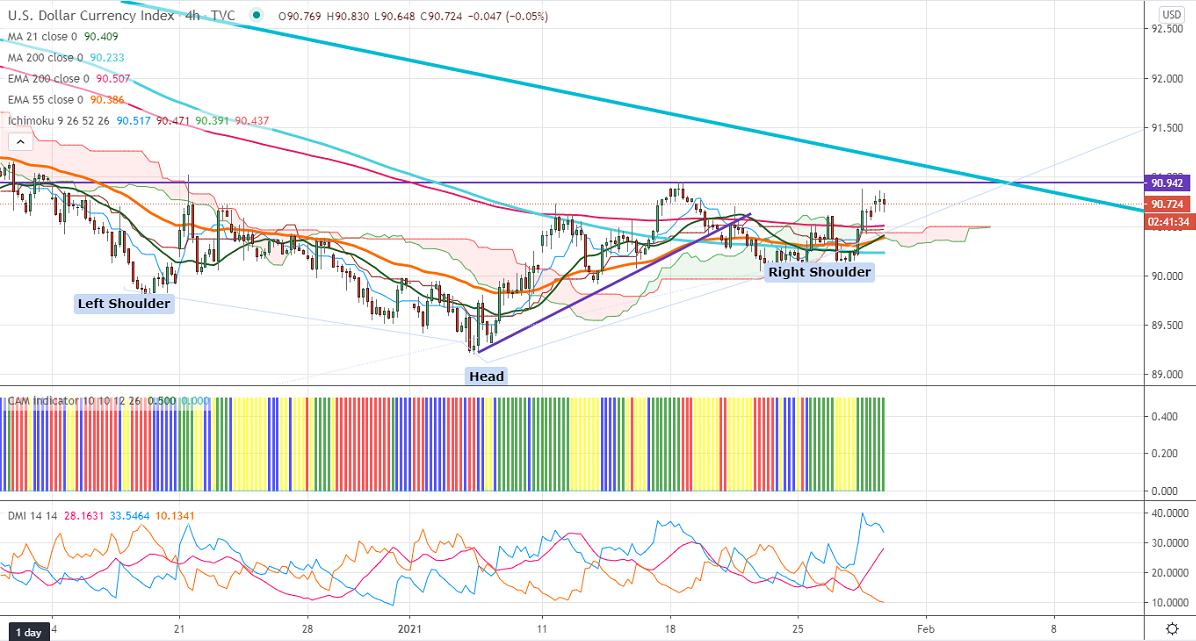
Chart Pattern- inverse head and shoulder
Ichimoku Analysis (4-Hour chart)
Tenken-Sen- 90.508
Kijun-Sen- 90.465
US Dollar index has formed an inverse head and shoulder pattern in one hour chart. Any break above neckline 91 confirms bullish continuation. The increase in risk aversion due to the surge in coronavirus cases is supporting the US dollar at lower levels. The Fed has kept its rates unchanged as expected. The central bank continues to see downside risk due to coronavirus pandemic and watching progress in vaccination for further action. The US 10-year yield lost more than 15% after forming a multi-year top of around at 1.184%. The intraday trend on DXY is slightly bullish as long as support 89.80 holds.
On the higher side, near-term resistance is around 91, convincing violation above targets 91.50. Significant bullishness only if it closes above 91.50. A jump till 93 likely.
The index is facing strong support at 90.38; any indicative break below will take the index to 90/89.80/89.20.
It is good to buy on dips around 90.45-50 with SL around 90 for TP of 91.49.


