


 FxWirePro : EUR/NZD holding below 38.2% fibo ahead of US data
  NZDJPY Bears Lie in Wait: Sell Rallies at 93 for 90 Target with 94 Stop
  FxWirePro: USD/CNY slips as strong China exports data Lift yuan
  AUDJPY Bears Poised: Sell Rallies at 111.55 for 108 Target with 112.20 Stop
  FxWirePro: GBP/AUD eases slightly, focus on near-term support
  Major Pair Currency Score: NZD/USD and AUD/USD Lead Forex Rally with Perfect 100 Scores
  EUR/USD Rockets Past 1.1560 as Soft U.S. Jobs Data Fuel Fed Rate-Cut Surge
  FxWirePro- Woodies pivot (Major)
  EURGBP Bears Break Trendline: Sell Rallies at 0.8578 as Support Breach Eyes 0.8450 Slide
  Bitcoin Reclaims $65,000 as Easing Geopolitical Tensions Fuel Risk-On Rally
  FxWirePro: USD/JPY holds tight range ahead of key U.S. payrolls data
  FxWirePro: USD/ZAR gains some ground, but downtrend remains
  FxWirePro : EUR/NZD slips lower after soft US jobs report
  FxWirePro: NZD/USD retreats as Middle East instability weighs


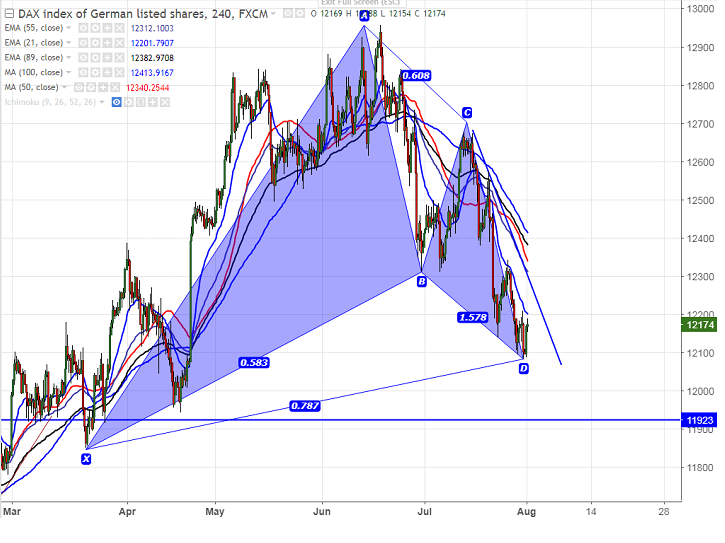
- Harmonic pattern formed- Bullish Gartley pattern.
- Potential Reversal Zone (PRZ) - 11856.
- DAX declined sharply after forming a temporary top at 12956 on Jun 20th 2017 and started to decline from that level. The index declined till 12083 on Jul 31st 2017 low. It is currently trading around 12180.
- The index has formed bullish Gartley pattern in daily Chart and any potential reversal zone is 11800 and any minor weakness can be seen below that level.
- On the higher side, near term resistance is around 12210 and any break above will take the index till 12342 (Jul 26th 2017 high)/12575 (Jul 20th 2017 high)/12673.The index should break above 12956 for bullish continuation.
- The near term support is around 12080 and any break below will drag the index down till 12000/11856.
It is good to buy on dips around 12050 with SL around 11850 for the TP of 12340/12570







