


 UBS Predicts Potential Fed Rate Cut Amid Strong US Economic Data
  China’s Growth Faces Structural Challenges Amid Doubts Over Data
  Geopolitical Shocks That Could Reshape Financial Markets in 2025
  Urban studies: Doing research when every city is different
  Oil Prices Dip Slightly Amid Focus on Russian Sanctions and U.S. Inflation Data
  US Gas Market Poised for Supercycle: Bernstein Analysts
  U.S. Stocks vs. Bonds: Are Diverging Valuations Signaling a Shift?
  Fed May Resume Rate Hikes: BofA Analysts Outline Key Scenarios
  Moldova Criticizes Russia Amid Transdniestria Energy Crisis
  Indonesia Surprises Markets with Interest Rate Cut Amid Currency Pressure
  Goldman Predicts 50% Odds of 10% U.S. Tariff on Copper by Q1 Close
  Wall Street Analysts Weigh in on Latest NFP Data
  China's Refining Industry Faces Major Shakeup Amid Challenges
  Moody's Upgrades Argentina's Credit Rating Amid Economic Reforms
  S&P 500 Relies on Tech for Growth in Q4 2024, Says Barclays
  Stock Futures Dip as Investors Await Key Payrolls Data


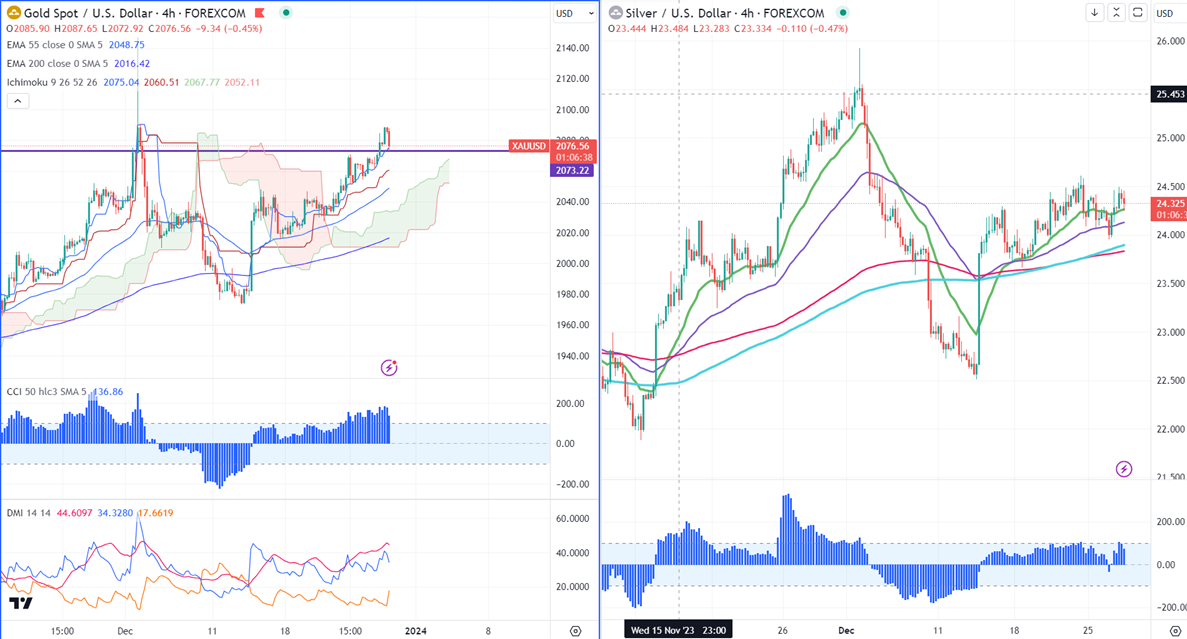
Gold -
Ichimoku Analysis (Weekly chart)
Tenken-Sen- $2061.15
Kijun-Sen- $2049.07
Gold recovered more than $10 on board-based US dollar selling. Richmond composite declined sharply to -11 in Dec, compared to a forecast of -4. The yellow metal hit a high of $2088.50 and is currently trading around $2076.60.
According to the CME Fed watch tool, the probability of a 25 bpbs rate cut in Jan increased to 17.6% from 12.4% a week ago.
Economic calendar -
Dec 28th, 2023, US initial jobless claims (1:30 pm GMT)
US Pending home sales (3 pm GMT)
US dollar index- Bearish. Minor support around 100.70/100. The near-term resistance is 101.50/102.
Factors to watch for gold price action-
Global stock market- Bullish (negative for gold)
US dollar index - Bearish (positive for gold)
US10-year bond yield- Bearish (Positive for gold)
Technical:
The near–term support is around $2059, a break below targets of $2050/ $2040/$2035/ $2020/ $2000/$1970. The yellow metal faces minor resistance around $2100 and a breach above will take it to the next level of $2150.
It is good to buy on dips around $2059 with SL around $2040 for TP of $2150.
Silver-
Silver showed a nice pullback following the footsteps of gold. The near-term resistance is around $24.61 (61.8% fib). Any daily close above $24.60 confirms further bullishness, a jump to $25/$26. Minor support is $23.60/$23.20.
Crude oil-
WTI crude oil prices declined slightly as the Red Sea supply disruption eased. Markets eye US EIA crude oil inventories today for further direction. Major resistance- $75.35/80. Significant support- $72/$70.


