


 FxWirePro- Major Crypto levels and bias summary
  FxWirePro- Major Crypto levels and bias summary
  FxWirePro- Major Crypto levels and bias summary


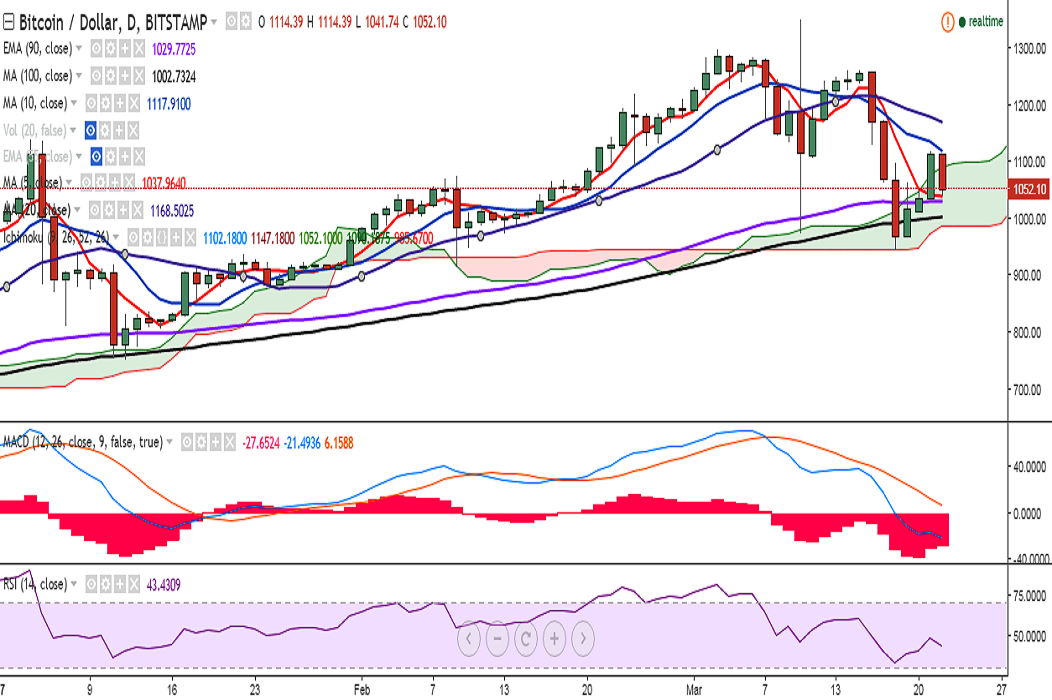
BTC/USD broke above Ichimoku Cloud on Tuesday and hit 1117.90 levels. However, the pair failed to hold its strength and turned red on Wednesday. It is currently trading at 1052 levels at press time (Bitstamp).
Ichimoku analysis of daily chart:
Tenkan Sen: 1102.18
Kijun Sen: 1147.18
The pair is facing strong resistance at 1111.66 levels (50-DMA) a consistent break above target 1135 (10-DMA)/1178 (20-DMA).
Momentum studies suggest bearish bias for the pair: RSI(14) is at 43, bias lower; and MACD line is below signal line. In the hourly chart, the pair has taken support near 1043 (1H 100-SMA) and a consistent break below would see further downside.
In the daily chart, the pair has taken support near 1041.74 (5-DMA) and any violation would drag it to 1029.27 (90-EMA)/999.98 (100-DMA)/ 944.36 (March 18 low).

- News

- Economy

- Central Banks
- Investing
- Research
- Roundups
- Digital Currency
- Insights
- Technical Analysis
- Technology
- Business
- Law
- Health
- Nature
- Fintech
- Science
- Topic
- Opinions
- ©Econometrics LLC . All Rights Reserved.
FxWirePro: BTC/USD faces strong resistance at 50-DMA, further bullishness only on break above
Wednesday, March 22, 2017 9:14 AM UTC
Editor's Picks


- Market Data
Most Popular


