


 FxWirePro- Major Crypto levels and bias summary
  BTC’s Bear Bounce: Sell the Rally Near $66K as Bears Target $59K–$52K Breakdown
  FxWirePro- Major Crypto levels and bias summary
  Ethereum Cracks Under $1,700: Sell the Rally Near $1,750 as Bears Eye $1,380–$1,200


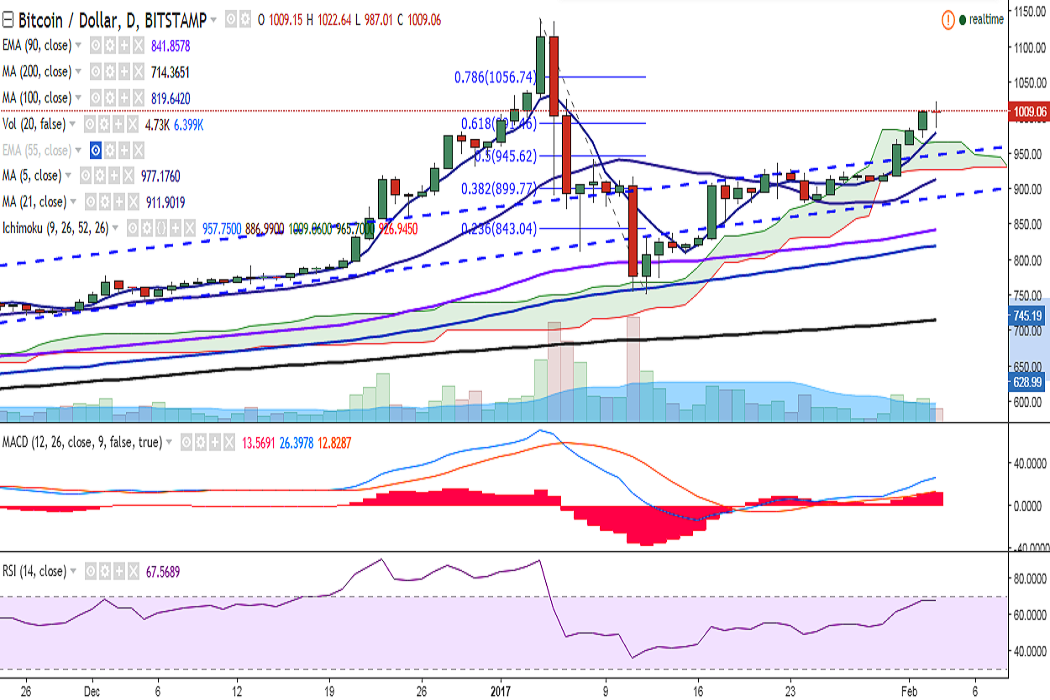
BTC/USD continued its uptrend on Friday and has hit a high of 1022 levels so far in the day. It is currently trading at 1010 levels at press time (Bitstamp).
Ichimoku analysis of daily chart:
Tenkan Sen: 948
Kijun Sen: 881.49
Trend reversal: 838.10 (90 EMA)
On the upside, a consistent break above 1026.99 (January 06 high) would see the pair testing 1056 (78.6% retracement of 1139.89 and 751.34)/ 1100.
Momentum studies remain bullish: RSI(14) is at 67, bias higher; and MACD line is above signal line, Stochs in overbought zone.
On the downside, the pair is likely to find support near 965 (Cloud top) and a break below would drag it to 945 (trend line joining 628.99 and 745.19)/903 (21-DMA).

- News

- Economy

- Central Banks
- Investing
- Research
- Roundups
- Digital Currency
- Insights
- Technical Analysis
- Technology
- Business
- Law
- Health
- Nature
- Fintech
- Science
- Topic
- Opinions
- ©Econometrics LLC . All Rights Reserved.
FxWirePro: BTC/USD breaks above 1,000, jump till 1056 likely
Friday, February 3, 2017 9:45 AM UTC
Editor's Picks


- Market Data
Most Popular


