


 US Magnificent 7 Stocks Trend Score: Amazon & Microsoft Hit Extreme Bullish (+100) as Meta Drops to -100 — Key Resistance & Support Watchlist
  FxWirePro: GBP/AUD drifts lower after BOE rate decision
  AUDJPY Volatile After Massive Sell-Off: Sell Rallies at 113, Targeting 110 as Bearish Momentum Surges
  FxWirePro:USD/JPY climbs back above 160.00 after BOJ rate decision
  FxWirePro- Major Crypto levels and bias summary
  FxWirePro: GBP/NZD remains weak, eyes 38.2%fib support
  JPY Currency Meter Signals: NZDJPY Bullish (+25) vs CHFJPY (-100) – These Pairs Could Move Next
  FxWirePro: GBP/NZD remains weak, eyes 38.2%fib support
  FxWirePro- Woodies pivot (Major)
  FxWirePro: GBP/AUD bears maintain upper hand
  FxWirePro: NZD/USD consolidates overnight gains, but loses momentum
  Major FX Action Bias & US Market Sentiment: NZD/USD (Extremely Bullish) & AUD/USD (Bullish) Watchlist
  NZDJPY Retreats on Yen Strength – Bearish Setup Targets 90 After Hitting 92.75 Low
  FxWirePro: USD/CAD retreats after Canada posts stronger-than-expected GDP growth
  FxWirePro: GBP/USD rises as soft US data pressures dollar


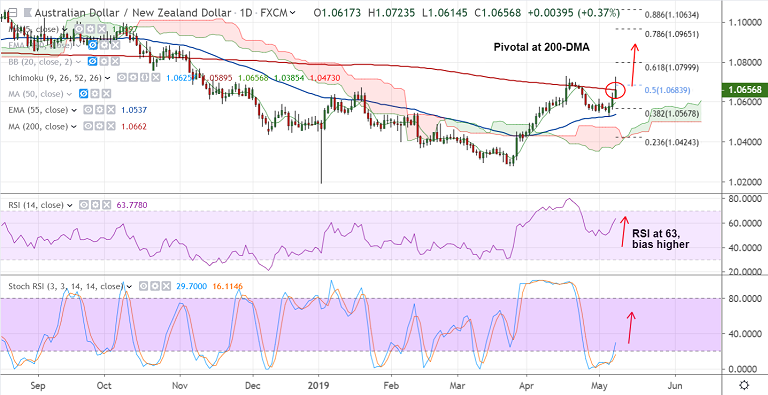
AUD/NZD chart - Trading View
- AUD/NZD edges lower from 3-week highs at 1.0723, bias is bullish.
- The pair finds stiff resistance at 200-DMA at 1.0662, close above could see further gains.
- Technical indicators are biased higher. RSI is above 60 levels and bias is higher.
- Stochs are on verge of rollover from oversold levels and MACD is on verge of bullish crossover on signal line.
- Close above 200-DMA will see gains till 61.8% Fib at 1.08 and then 1.0882 (Oct 29 high).
- On the flipside, failure at 200-DMA will see retrace till 55-EMA at 1.0537. Violation there negates the bullish bias.
Support levels - 1.0614 (20-DMA), 1.0585 (21-EMA), 1.0537 (55-EMA)
Resistance levels - 1.0662 (200-DMA), 1.0729 (Apr 17 high), 1.08 (61.8% Fib)
For details on FxWirePro's Currency Strength Index, visit http://www.fxwirepro.com/currencyindex.


