


 FxWirePro: USD/CAD retreats after Canada posts stronger-than-expected GDP growth
  FxWirePro: EUR/ AUD dips below 1.6400 level, focus on near term support
  FxWirePro: GBP/NZD remains weak, eyes 38.2%fib support
  US Magnificent 7 Stocks Trend Score: Amazon & Microsoft Hit Extreme Bullish (+100) as Meta Drops to -100 — Key Resistance & Support Watchlist
  FxWirePro: GBP/USD rises as soft US data pressures dollar
  NZDJPY Retreats on Yen Strength – Bearish Setup Targets 90 After Hitting 92.75 Low
  NZDJPY Bullish Rebound: Buy Dips as EMAs Align for 97 Target
  FxWirePro- Major Pair levels and bias summary
  FxWirePro: USD/ZAR gains as stronger dollar outweighs upbeat South Africa's trade surplus
  FxWirePro: GBP/AUD bears maintain upper hand
  FxWirePro- Major Crypto levels and bias summary
  FxWirePro:USD/JPY climbs back above 160.00 after BOJ rate decision
  FxWirePro- Woodies pivot (Major)
  Major FX Action Bias & US Market Sentiment: NZD/USD (Extremely Bullish) & AUD/USD (Bullish) Watchlist
  FxWirePro- Major Pair levels and bias summary


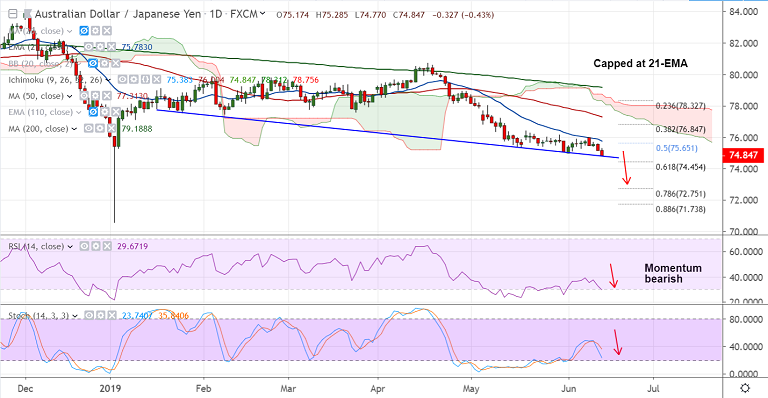
AUD/JPY chart - Trading View
AUD/JPY capped at 21-EMA, intraday bias bearish.
Momentum with the bears, Stochs and RSI sharply lower and RSI well below 50 level.
Volatility is rising as indicated by the widening Bollinger Bands.
Stochastics RSI is rolling over from overbought levels which suggests downside for oscillators.
The pair finds strong support at 74.75 (falling trendline), break below will see further weakness.
Next immediate support lies at 74.45 (61.8% Fib), break below will see dip till 72.75 (78.6% Fib).
5-DMA is immediate resistance at 75.34. Break above 21-EMA will see minor upside.
Support levels - 74.75 (trendline), 74.45 (61.8% Fib), 72.75 (78.6% Fib)
Resistance levels - 75.34 (5-DMA), 75.78 (21-EMA), 76
Recommendation: Good to go short on upticks, SL: 75.40, TP: 74.45/ 74/ 72.75
For details on FxWirePro's Currency Strength Index, visit http://www.fxwirepro.com/currencyindex.


