


 FxWirePro- Woodies pivot (Major)
  FxWirePro: USD/ZAR gains as stronger dollar outweighs upbeat South Africa's trade surplus
  FxWirePro- Woodies pivot (Major)
  FxWirePro- Major Pair levels and bias summary
  FxWirePro- Major Pair levels and bias summary
  FxWirePro: GBP/NZD remains weak, eyes 38.2%fib support
  Nikkei Surges Past 65,000 on Suspected Yen Weakness: Tech Giants Like Advantest and NEC Lead Explosive Gains
  FxWirePro: GBP/AUD bears maintain upper hand
  FxWirePro:USD/JPY climbs back above 160.00 after BOJ rate decision
  NZDJPY Bullish Rebound: Buy Dips as EMAs Align for 97 Target
  FxWirePro: GBP/NZD remains weak, eyes 38.2%fib support
  FxWirePro: NZD/USD consolidates overnight gains, but loses momentum
  US Magnificent 7 Stocks Trend Score: Amazon & Microsoft Hit Extreme Bullish (+100) as Meta Drops to -100 — Key Resistance & Support Watchlist
  FxWirePro: USD/CAD retreats after Canada posts stronger-than-expected GDP growth
  US Magnificent 7 Stocks Trend Score: Amazon & Microsoft Hit Extreme Bullish (+100) as Meta Drops to -100 — Key Resistance & Support Watchlist
  NZDJPY Retreats on Yen Strength – Bearish Setup Targets 90 After Hitting 92.75 Low


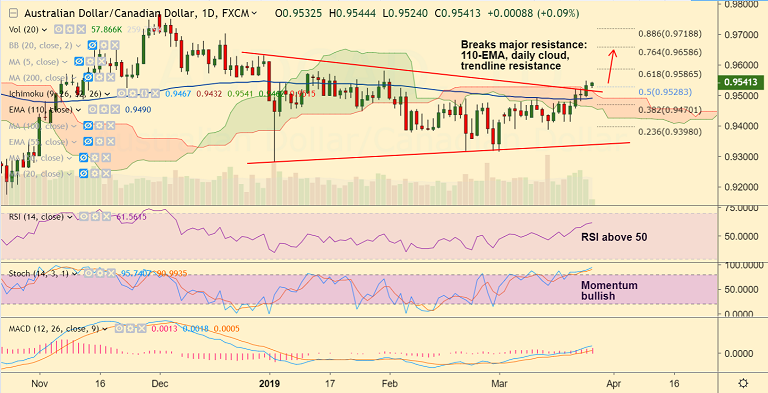
AUD/CAD chart - Trading View
- AUD/CAD is extending gains for the 5th straight week, bias bullish.
- The pair has broken out of daily cloud and major trendline resistance at 0.9515.
- The pair is extending gains above 110-EMA and is on track to test 61.8% Fib.
- Technical analysis is bullish. RSI is above 50, bias higher. Stochs show bullish momentum.
- Next immediate resistance lies at 55W EMA at 0.9574, breakout eyes 76.4% Fib at 0.9658.
- On the flipside, retrace below 110-EMA will see weakness till trendline support at 0.9335.
Support levels - 0.9515 (cloud top), 0.9490 (110-EMA), 0.9470 (38.2% Fib)
Resistance levels - 0.9574 (55W EMA), 0.9586 (61.8% Fib), 0.96
Recommendation: Good to go long on dips around 0.9530, SL: 0.9490, TP: 0.9575/ 0.96/ 0.9630
For details on FxWirePro's Currency Strength Index, visit http://www.fxwirepro.com/currencyindex.


