


 FxWirePro: USD/CAD retreats after Canada posts stronger-than-expected GDP growth
  FxWirePro- Major Crypto levels and bias summary
  FxWirePro- Major Pair levels and bias summary
  FxWirePro: GBP/NZD remains weak, eyes 38.2%fib support
  US Magnificent 7 Stocks Trend Score: Amazon & Microsoft Hit Extreme Bullish (+100) as Meta Drops to -100 — Key Resistance & Support Watchlist
  FxWirePro: AUD/USD gains some ground but outlook is bearish
  FxWirePro: EUR/ AUD dips below 1.6400 level, focus on near term support
  Nikkei Surges Past 65,000 on Suspected Yen Weakness: Tech Giants Like Advantest and NEC Lead Explosive Gains
  FxWirePro:USD/JPY climbs back above 160.00 after BOJ rate decision
  FxWirePro- Woodies pivot (Major)
  Major FX Action Bias & US Market Sentiment: NZD/USD (Extremely Bullish) & AUD/USD (Bullish) Watchlist
  FxWirePro: GBP/NZD remains weak, eyes 38.2%fib support
  FxWirePro- Major Pair levels and bias summary
  AUDJPY Volatile After Massive Sell-Off: Sell Rallies at 113, Targeting 110 as Bearish Momentum Surges
  FxWirePro- Major Crypto levels and bias summary


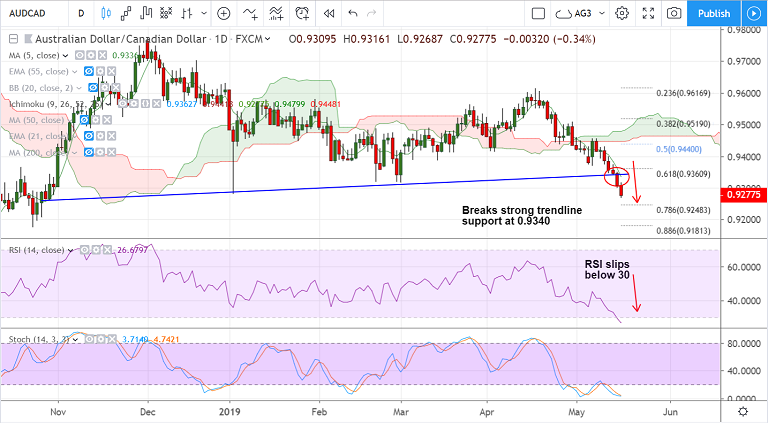
AUD/CAD chart - Trading View
- AUD/CAD has broken strong trendline support at 0.9340, bias lower.
- Near-term trend in the pair has shown a shift as indicated by GMMA indicator.
- Recovery attempts capped at cloud which offers stiff resistance. Price action is below major moving averages.
- Technical indicators support further weakness. Volatility is rising and RSI and Stochs are sharply lower.
- Next immediate support lies at 78.6% Fib at 0.9248. Break below will see dip till 0.9175 (Oct 24 low).
- 5-DMA is immediate resistance at 0.9336, retrace above trendline support turned resistance at 0.9340 could see minor upside.
Support levels - 0.9248 (78.6% Fib), 0.92, 0.9175 (Oct 24 low)
Resistance levels - 0.9336 (5-DMA), 0.9360 (61.8% Fib), 0.94
For more details on FxWirePro's Currency Strength Index, visit http://www.fxwirepro.com/currencyindex.


