


 NZDJPY Bullish Rebound: Buy Dips as EMAs Align for 97 Target
  FxWirePro- Major Pair levels and bias summary
  US Magnificent 7 Stocks Trend Score: Amazon & Microsoft Hit Extreme Bullish (+100) as Meta Drops to -100 — Key Resistance & Support Watchlist
  FxWirePro: NZD/USD consolidates overnight gains, but loses momentum
  FxWirePro: GBP/NZD remains weak, eyes 38.2%fib support
  FxWirePro: GBP/USD rises as soft US data pressures dollar
  FxWirePro: GBP/AUD bears maintain upper hand
  JPY Currency Meter Signals: NZDJPY Bullish (+25) vs CHFJPY (-100) – These Pairs Could Move Next
  FxWirePro- Major Crypto levels and bias summary
  US Magnificent 7 Stocks Trend Score: Amazon & Microsoft Hit Extreme Bullish (+100) as Meta Drops to -100 — Key Resistance & Support Watchlist
  FxWirePro: GBP/AUD drifts lower after BOE rate decision
  FxWirePro: USD/ZAR gains as stronger dollar outweighs upbeat South Africa's trade surplus
  FxWirePro- Major Crypto levels and bias summary
  FxWirePro: EUR/ AUD dips below 1.6400 level, focus on near term support
  FxWirePro: AUD/USD gains some ground but outlook is bearish
  Major European Indices Score Extremely Bullish: DAX Eyes 26000, CAC Targets 8600, FTSE100 at 11000 – Key Levels to Watch


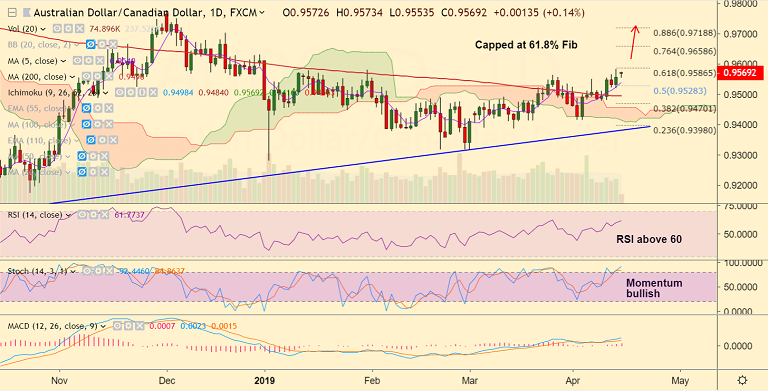
AUD/CAD chart - Trading View
AUD/CAD Technical Analysis: Bias Bullish
- Edges higher from session lows at 0.9553
- Extends gains above 200-DMA and daily cloud
- RSI above 60, bias higher
- Momentum studies bullish, Stochs sharply higher
- Capped below 61.8% Fib, break above eyes trendline resistance at 0.9655
Data Watch:
- Focus on Bank of Canada’s (BOC) business outlook survey report for further impetus
Support levels - 0.9540 (5-DMA), 0.9496 (200-DMA), 0.9456 (cloud top)
Resistance levels - 0.9586 (61.8% Fib), 0.9631 (Dec 31st high), 0.9655 (Trendline)
Recommendation: Good to stay long on dips, SL: 0.9540, TP: 0.9585/ 0.9630/ 0.9650
For details on FxWirePro's Currency Strength Index, visit http://www.fxwirepro.com/currencyindex.

- News

- Economy

- Central Banks
- Investing
- Research
- Roundups
- Digital Currency
- Insights
- Technical Analysis
- Technology
- Business
- Law
- Health
- Nature
- Fintech
- Science
- Topic
- Opinions
- ©Econometrics LLC . All Rights Reserved.
FxWirePro: AUD/CAD Trade Idea
Monday, April 15, 2019 10:28 AM UTC
Editor's Picks


- Market Data
Most Popular


