


 Major FX Action Bias & US Market Sentiment: NZD/USD (Extremely Bullish) & AUD/USD (Bullish) Watchlist
  FxWirePro: GBP/AUD drifts lower after BOE rate decision
  FxWirePro: NZD/USD consolidates overnight gains, but loses momentum
  FxWirePro: EUR/ AUD dips below 1.6400 level, focus on near term support
  Major European Indices Score Extremely Bullish: DAX Eyes 26000, CAC Targets 8600, FTSE100 at 11000 – Key Levels to Watch
  FxWirePro- Major Crypto levels and bias summary
  FxWirePro: AUD/USD gains some ground but outlook is bearish
  US Magnificent 7 Stocks Trend Score: Amazon & Microsoft Hit Extreme Bullish (+100) as Meta Drops to -100 — Key Resistance & Support Watchlist
  FxWirePro- Woodies pivot (Major)
  FxWirePro:USD/JPY climbs back above 160.00 after BOJ rate decision
  AUD/JPY Slips Below 112 as BOJ Intervention Sparks Bearish Momentum: Sell the Rallies
  FxWirePro: USD/ZAR gains as stronger dollar outweighs upbeat South Africa's trade surplus
  FxWirePro- Woodies pivot (Major)
  FxWirePro: USD/CAD retreats after Canada posts stronger-than-expected GDP growth
  FxWirePro- Major Pair levels and bias summary
  FxWirePro: GBP/AUD bears maintain upper hand
  NZDJPY Bullish Rebound: Buy Dips as EMAs Align for 97 Target


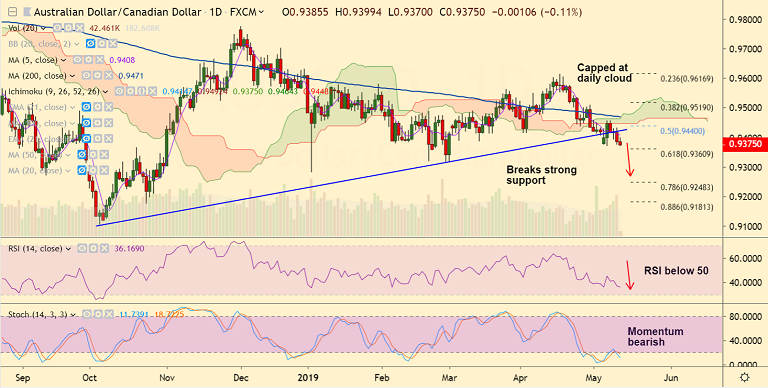
AUD/CAD chart - Trading View
- AUD/CAD rejected at session highs at 0.9399, bias bearish.
- Near-term trend in the pair has turned bearish as indicated by GMMA indicator.
- Recovery attempts capped at cloud which offers stiff resistance at 0.9448.
- Price action is below cloud and major moving averages and technical indicators are supporting wekaness.
- Volatility is rising as evidenced by expanding Bollinger Bands and RSI and Stochs are sharply lower.
- Break below strong trendline support at 0.94, raises scope for further weakness.
- Next immediate support lies at 61.8% Fib at 0.9360. Break below will see dip till 0.9318 (trendline).
- 5-DMA is immediate resistance at 0.9409, break above cloud and 200-DMA negates bearish bias.
Support levels - 0.9360 (61.8% Fib), 0.9316 (Mar 1 low), 0.9248 (78.6% Fib)
Resistance levels - 0.9409 (5-DMA), 0.9471 (nearly converged cloud and 200-DMA), 0.95
For details on FxWirePro's Currency Strength Index, visit http://www.fxwirepro.com/currencyindex.


