


 Fed Confirms Rate Meeting Schedule Despite Severe Winter Storm in Washington D.C.
  Fed Governor Lisa Cook Warns Inflation Risks Remain as Rates Stay Steady
  BOJ Holds Interest Rates Steady, Upgrades Growth and Inflation Outlook for Japan
  BOJ Rate Decision in Focus as Yen Weakness and Inflation Shape Market Outlook


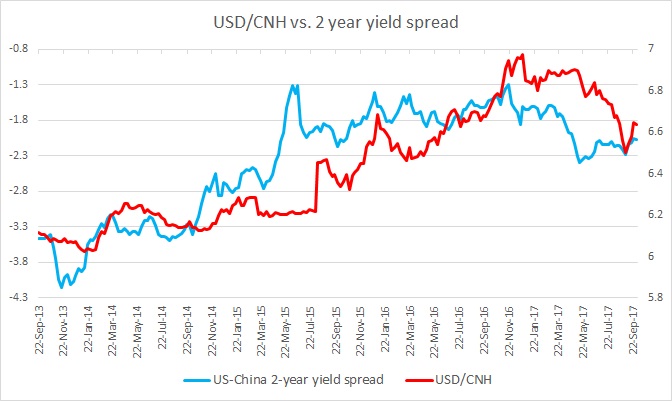
This chart shows the relation between U.S. - China 2-year yield spread and the Dollar/Chinese yuan exchange rate since 2013. It is visible even with naked eyes that the two has enjoyed a very close relationship. It can also be seen that the infamous August 2015 devaluation of the Chinese yuan by the People’s Bank of China (PBoC) that led to a global financial turmoil could very well be the result of rising U.S./China 2-year spread.
Since March 2015, the yield spread between the United States and China’s 2-year bond rose from -276.6 basis to -131.3 basis points in favour of the dollar by June, while the exchange rate was kept flat around 6.2 per dollar. Finally, PBoC had to respond by a one-time devaluation of the yuan to 6.46 for per dollar. This shows, how significant the spread is for the pair.
In our last review in mid- September, we pointed to the spread to explain the recent strengthening of the yuan against the USD. We noted that since the U.S. election, the yield spread has widened from -129 basis points to -216 basis points in favour of the yuan. Naturally, the exchange rate has responded by declining from 6.95 per dollar to 6.54 per dollar.
Since that review, the yield spread has narrowed from 216 basis points to 206 basis points in favour of the dollar and the yuan has weakened around 90 pips against the dollar. The exchange rate is currently at 6.64 per dollar. We can see that the exchange rate has corrected more, creating a small divergence.
We would like to recommend close watching of the spreads and communications from both central banks.


