


 FxWirePro- Major Crypto levels and bias summary
  FxWirePro- Major Pair levels and bias summary
  FxWirePro: AUD/USD gains some ground but outlook is bearish
  FxWirePro- Woodies pivot (Major)
  AUDJPY Volatile After Massive Sell-Off: Sell Rallies at 113, Targeting 110 as Bearish Momentum Surges
  FxWirePro- Major Crypto levels and bias summary
  FxWirePro: USD/CAD retreats after Canada posts stronger-than-expected GDP growth
  JPY Currency Meter Signals: NZDJPY Bullish (+25) vs CHFJPY (-100) – These Pairs Could Move Next
  FxWirePro: USD/ZAR gains as stronger dollar outweighs upbeat South Africa's trade surplus
  US Magnificent 7 Stocks Trend Score: Amazon & Microsoft Hit Extreme Bullish (+100) as Meta Drops to -100 — Key Resistance & Support Watchlist
  FxWirePro:USD/JPY climbs back above 160.00 after BOJ rate decision
  FxWirePro: USD/CNY dips to hit three year low,scope for further downside
  FxWirePro- Major Pair levels and bias summary
  FxWirePro: GBP/NZD remains weak, eyes 38.2%fib support
  US Magnificent 7 Stocks Trend Score: Amazon & Microsoft Hit Extreme Bullish (+100) as Meta Drops to -100 — Key Resistance & Support Watchlist


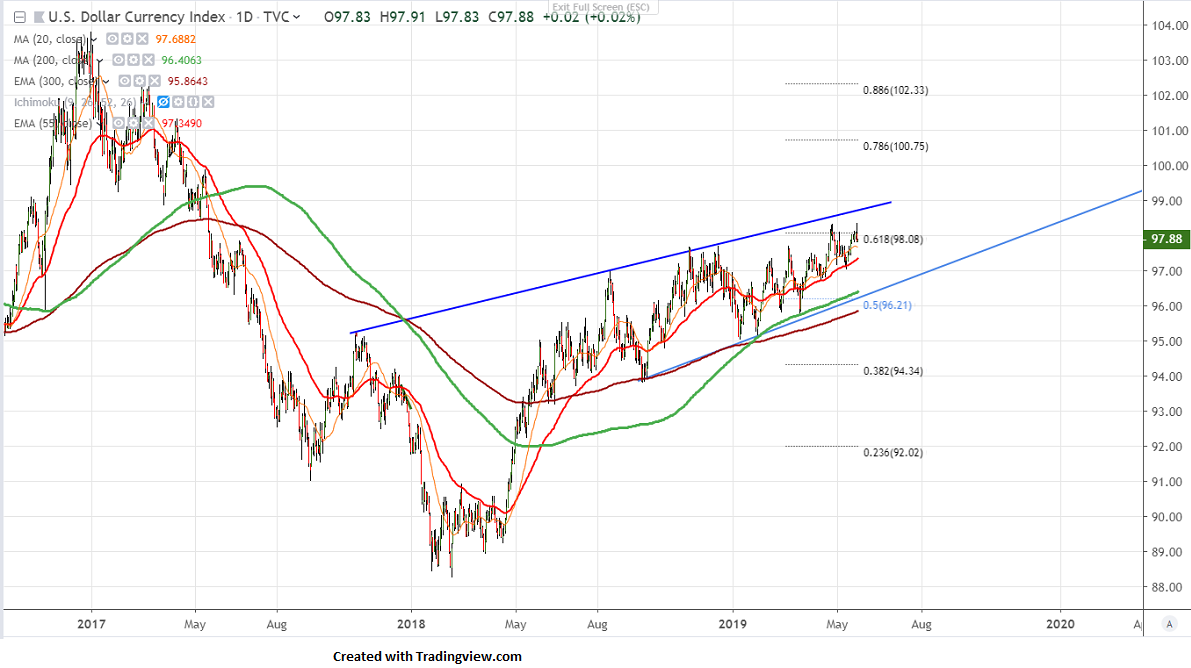
Trend line resistance- 98.76
DXY has halted its 10- day on winning streak and shown a minor decline from high of 98.37. The index made a low of 97.03 on May 13th 2019 and jumped more than 130 pips from that level. It is currently trading around 97.86.
The near term resistance is around 98.75 (trend line joining 95.15 and 96.79) and any break above will take the index to next level till 99.26/99.75.
The near term support is around 97.68 (20- day MA) and any violation below will drag the index till 97.35/97. Any major weakness only below 97.
It is good to sell on rallies around 98.10-20 with SL around 98.75 for the TP of 97.02.







