


 AUDJPY Trades in Narrow Range, Bearish Indicators Suggest Selling on Rallies
  FxWirePro- Woodies Pivot (Major)
  EURUSD Holds Above 1.1600 Despite US CPI, Fed Rate Hike on the Horizon
  NZDJPY Consolidates, Resistance at 90.78 May Signal Favorability for Downtrend
  Gold Loses Luster Amid Rising US Bond Yields, Iran Conflict; Sell on Rallies Advised
  FxWirePro: EUR/NZD eases after hot US CPI data
  FxWirePro- Major Crypto levels and bias summary


, bias strongly bullish - EconoTimes)


 Add as a preferred source on Google
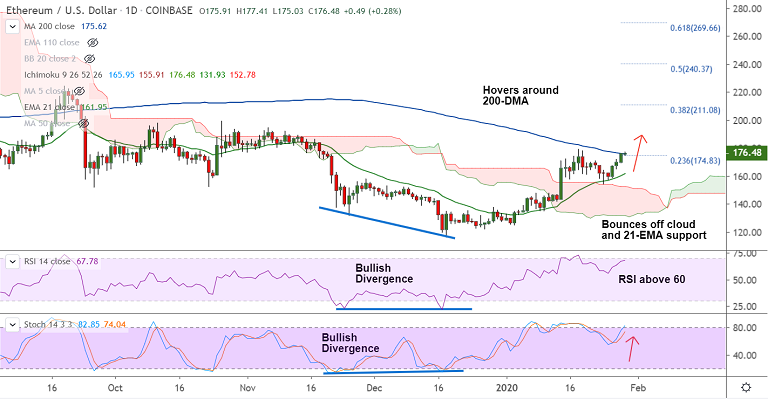
ETH/USD chart - Trading View
Exchange - Coinbase
Technical Analysis: Bias Bullish
GMMA Indicator: Major Trend - Bullish; Minor Trend - Bullish
Overbought/ Oversold Index: Approaching overbought
Volatility: Shrinking
Support: 170.02 (5-DMA); Resistance: 183.63 (Upper BB)
ETH/USD is consolidating previous session's gains, trades comatose around 200-DMA (175.62).
The pair has bounced off strong support at 21-EMA and daily cloud and is on track for further gains.
Price action is extending break above 21W EMA (166.80) and technical indicators have turned bullish.
Major and minor trend as evidenced by the GMMA indicator are bullish and breakout at 200-DMA will propel the pair higher.
Next major hurdle lies at 55W EMA at 167.02 ahead of 110W EMA at 208.96 and 38.2% Fib at 211.08.
5-DMA is immediate support at 170.02. Rejection at 200-DMA and break below 21-EMA (161.96) will see near-term weakness.







