


 FxWirePro- Major Crypto levels and bias summary
  Crypto Alpha Command: BTC & ETH derivatives Intelligence


 Add as a preferred source on Google
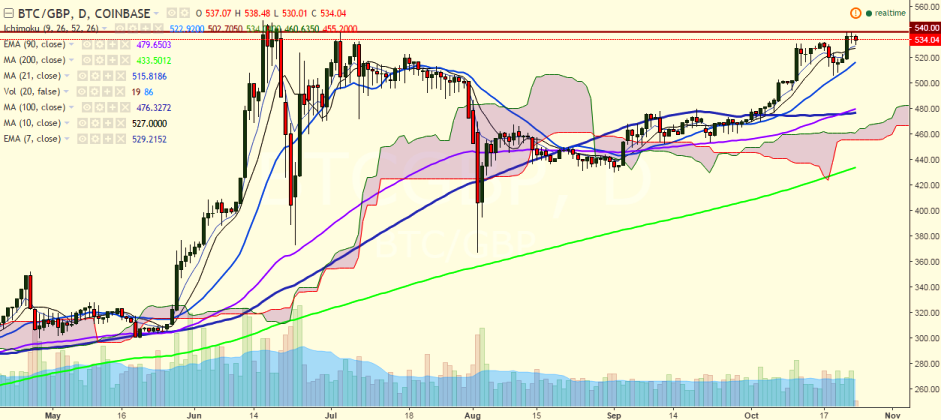
BTC/GBP broke above the previous high of 532 levels and hit 540 levels on October 22. It is currently trading slightly lower at 534 levels at the time of writing (Coinbase).
Long-term trend: Bullish
Short-term trend: Bullish
Ichimoku analysis of daily chart:
Tenkan Sen: 522.92
Kijun Sen: 500.41
Trend reversal: 478.42 (90 EMA)
The pair ran into resistance at 540 levels (127.2% retracement of 532.69 and 505.84) and a break above would target 549.28 (161.8% retracement of 532.69 and 505.84)/ 573 (113% retracement of 549.45 and 367.10).
On the downside, the pair has taken support near 527.60 (7-EMA) and any violation would drag the pair to 513.28 (21-DMA)/500.

- News

- Economy

- Central Banks
- Investing
- Research
- Roundups
- Digital Currency
- Insights
- Technical Analysis
- Technology
- Business
- Law
- Health
- Nature
- Fintech
- Science
- Topic
- Opinions
- ©Econometrics LLC . All Rights Reserved.
BTC/GBP faces strong resistance at 540, break above targets 575
Monday, October 24, 2016 10:57 AM UTC
Editor's Picks



- Market Data
Most Popular




