


 European Stocks Fall as US-Iran Conflict Rekindles Energy Supply Fears
  Asian Stocks Rally as Japan’s Nikkei Hits Record High on U.S.-Iran Peace Optimism
  Dollar Slips as Strong U.S. Jobs Data Reduces Fed Rate Cut Expectations
  Asian Stocks Slide as Iran Tensions Escalate Despite Strong Weekly Gains
  Gold Prices Rise as Weaker Dollar and U.S.-Iran Peace Hopes Boost Demand
  Trump Signals Possible U.S.-Iran Peace Deal as Markets Rally on Hopes of War Ending
  Russian LNG Shadow Fleet Expands Amid Arctic LNG 2 Sanctions
  Oil Prices Rise Amid Strait of Hormuz Tensions and U.S.-Iran Ceasefire Uncertainty
  Gold Prices Hold Firm as Iran Tensions and Dollar Swings Drive Safe-Haven Demand
  Oil Prices Rebound Slightly After Sharp Drop on Iran Deal Hopes
  Asian Currencies Slip as US Dollar Gains on Rising Iran Tensions and Awaited Jobs Data
  China Export Growth Surges in April as Global Buyers Rush to Secure Supplies
  Lula and Trump Talks Signal New Phase in Brazil-US Relations
  Japan’s Yen Intervention and BOJ Rate Hike Bets Support Currency Recovery
  Dollar Weakens as Iran Peace Hopes Boost Risk Appetite and Yen Gains Strength
  US-Iran Ceasefire Under Pressure as Fresh Strait of Hormuz Clashes Shake Oil Markets


This week provided a first tiny glimpse into the labour-market fallout from Australia’s recent lockdowns.
Australian Bureau of Statistics published the wage price index for the June quarter yesterday, showing sluggish wages growth, below forecasts. The labour force figures for July, out today, is an impressive 4.6%, but tempered by the number of people who have stopped looking for work and a higher underemployment rate.
These numbers tell us how the labour market is recovering from last year’s massive pandemic hit. It’s also a sneak peak into how it might be affected by the current lockdowns.
The Greater Sydney lockdown officially began on June 26 – right at the end of the June quarter (the virus had been circulating in Sydney since mid June). So the June quarter figures give us a baseline for the labour market before the big hit from what looks like several months of lockdowns in Sydney, NSW and maybe beyond. We also have a glimpse of the first two weeks of the “self-lockdown” in Sydney, where people pull back on economic activity due to the virus circulating.
Annual wages growth of 1.7%
The wage price index — measuring wages growth — increased by 0.4% in the June quarter. This was below consensus forecasts of 0.6%, and put the annual rate at 1.7%. This just above the 2020 low of 1.4%.
Wage price index, annual growth
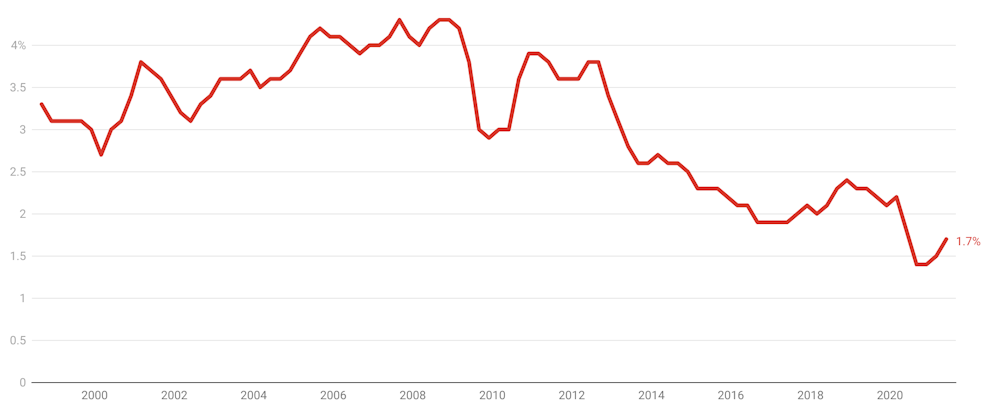
Total hourly rates of pay excluding bonuses, seasonally adjusted. Change from corresponding quarter of previous year. ABS Wage Price Index
All that anecdotal chatter about how it has been impossible to get workers in this industry or that certainly didn’t make its way into the aggregate data.
There were sectoral differences in wage pressures. Three sectors recorded annual increases in wages above 2% — construction (2.2%), professional services (2.5%) and other services (2.6%). The smallest increases were in rental, hiring and real estate services (1.1%), administrative and support services (1.0%) and arts and recreation services (0.9%).
Unemployment rate hits 4.6%
Thursday’s labour force figures came on the back of a stunningly good June rate of 4.9%. July’s rate is stunning again. Kind of.
The monthly unemployment rate dropping to 4.6% represented 39,900 fewer unemployed persons and a slight increase in employed persons, by 2,200 to 13,156,400.
Unemployment rate, seasonally adjusted
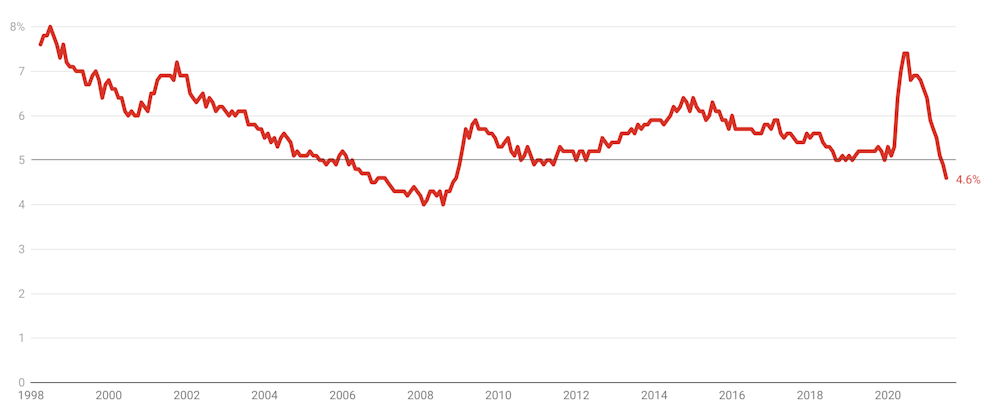
Less positive was that the 4.6% rate also reflected a drop in labour force participation, from 66.2% to 66.0%, and that the official underemployment rate jumped from 7.9% to 8.3%.
The fuzzy demarcation between what makes one unemployed versus underemployed as well as the effect of people leaving the labour market is why I always focus in all jobs figures on the “total hours worked”.
This remained effectively steady in July, at 1.778 billion hours.
Overall, therefore, these figures represent very good news. Perhaps the most important implication is that all the naysayers who suggested we could never get unemployment down to or below 4% look — at least so far — wrong.
The immigration illusion
Speaking of folks being wrong, the jobs data also bear on Reserve Bank of Australia governors Philip Lowe’s recent statements about the effect of immigration and wages.
In a speech in early July Lowe suggested high levels of immigration in recent years was an important reason for low wages growth.
Others, including myself, think this view is not supported by the data. Low wages growth since 2013 has a lot more to do with global shifts in technology, the phenomenon of “secular stagnation”, and the fact the Reserve Bank kept interest rates too high, for too long, until finally giving into pressure to cut them in 2019.
The latest data — if looking at the data is your thing — show that, with effectively zero immigration wages, growth remains low. It’s barely moving even in the sectors where immigration is meant to play the biggest role, such as services and construction.
Moreover, even with unemployment falling to 4.6%, there’s relatively little upward pressure. This suggests getting unemployment down to or below 4% not only might be achievable but necessary to get inflation back into the RBA’s target band of 2–3%.
Lockdown impacts still to come
That said, this might be the last good news for a while.
The next quarter’s figures will capture the effect of lockdown for perhaps the entire three months in Greater Sydney, as well as a signifcant amount of time elsewhere. Fiscal support measures such as JobSaver and the Disaster Payment definitely help but they will only stem a flow of bad labour-market numbers.
In the longer term, though, we can and should expect our policy makers — fiscal and monetary — to show us an unemployment number with a 3 in front of it in 2022 or 2023.


