


 U.S. Stock Futures Slide as Tech Rout Deepens on Amazon Capex Shock
  Singapore Budget 2026 Set for Fiscal Prudence as Growth Remains Resilient
  Bank of Japan Signals Readiness for Near-Term Rate Hike as Inflation Nears Target
  U.S.-India Trade Framework Signals Major Shift in Tariffs, Energy, and Supply Chains
  South Africa Eyes ECB Repo Lines as Inflation Eases and Rate Cuts Loom
  South Korea Assures U.S. on Trade Deal Commitments Amid Tariff Concerns
  Dollar Near Two-Week High as Stock Rout, AI Concerns and Global Events Drive Market Volatility
  FxWirePro: Daily Commodity Tracker - 21st March, 2022
  China Extends Gold Buying Streak as Reserves Surge Despite Volatile Prices


Donald Trump is right in trying to revive the U.S. manufacturing during his tenor as the President but it is far from clear whether he would succeed in reversing the sad depletion of U.S. manufacturing or not. Below are some of the facts of that shows how the manufacturing and its jobs depleted in the United States, over the years.
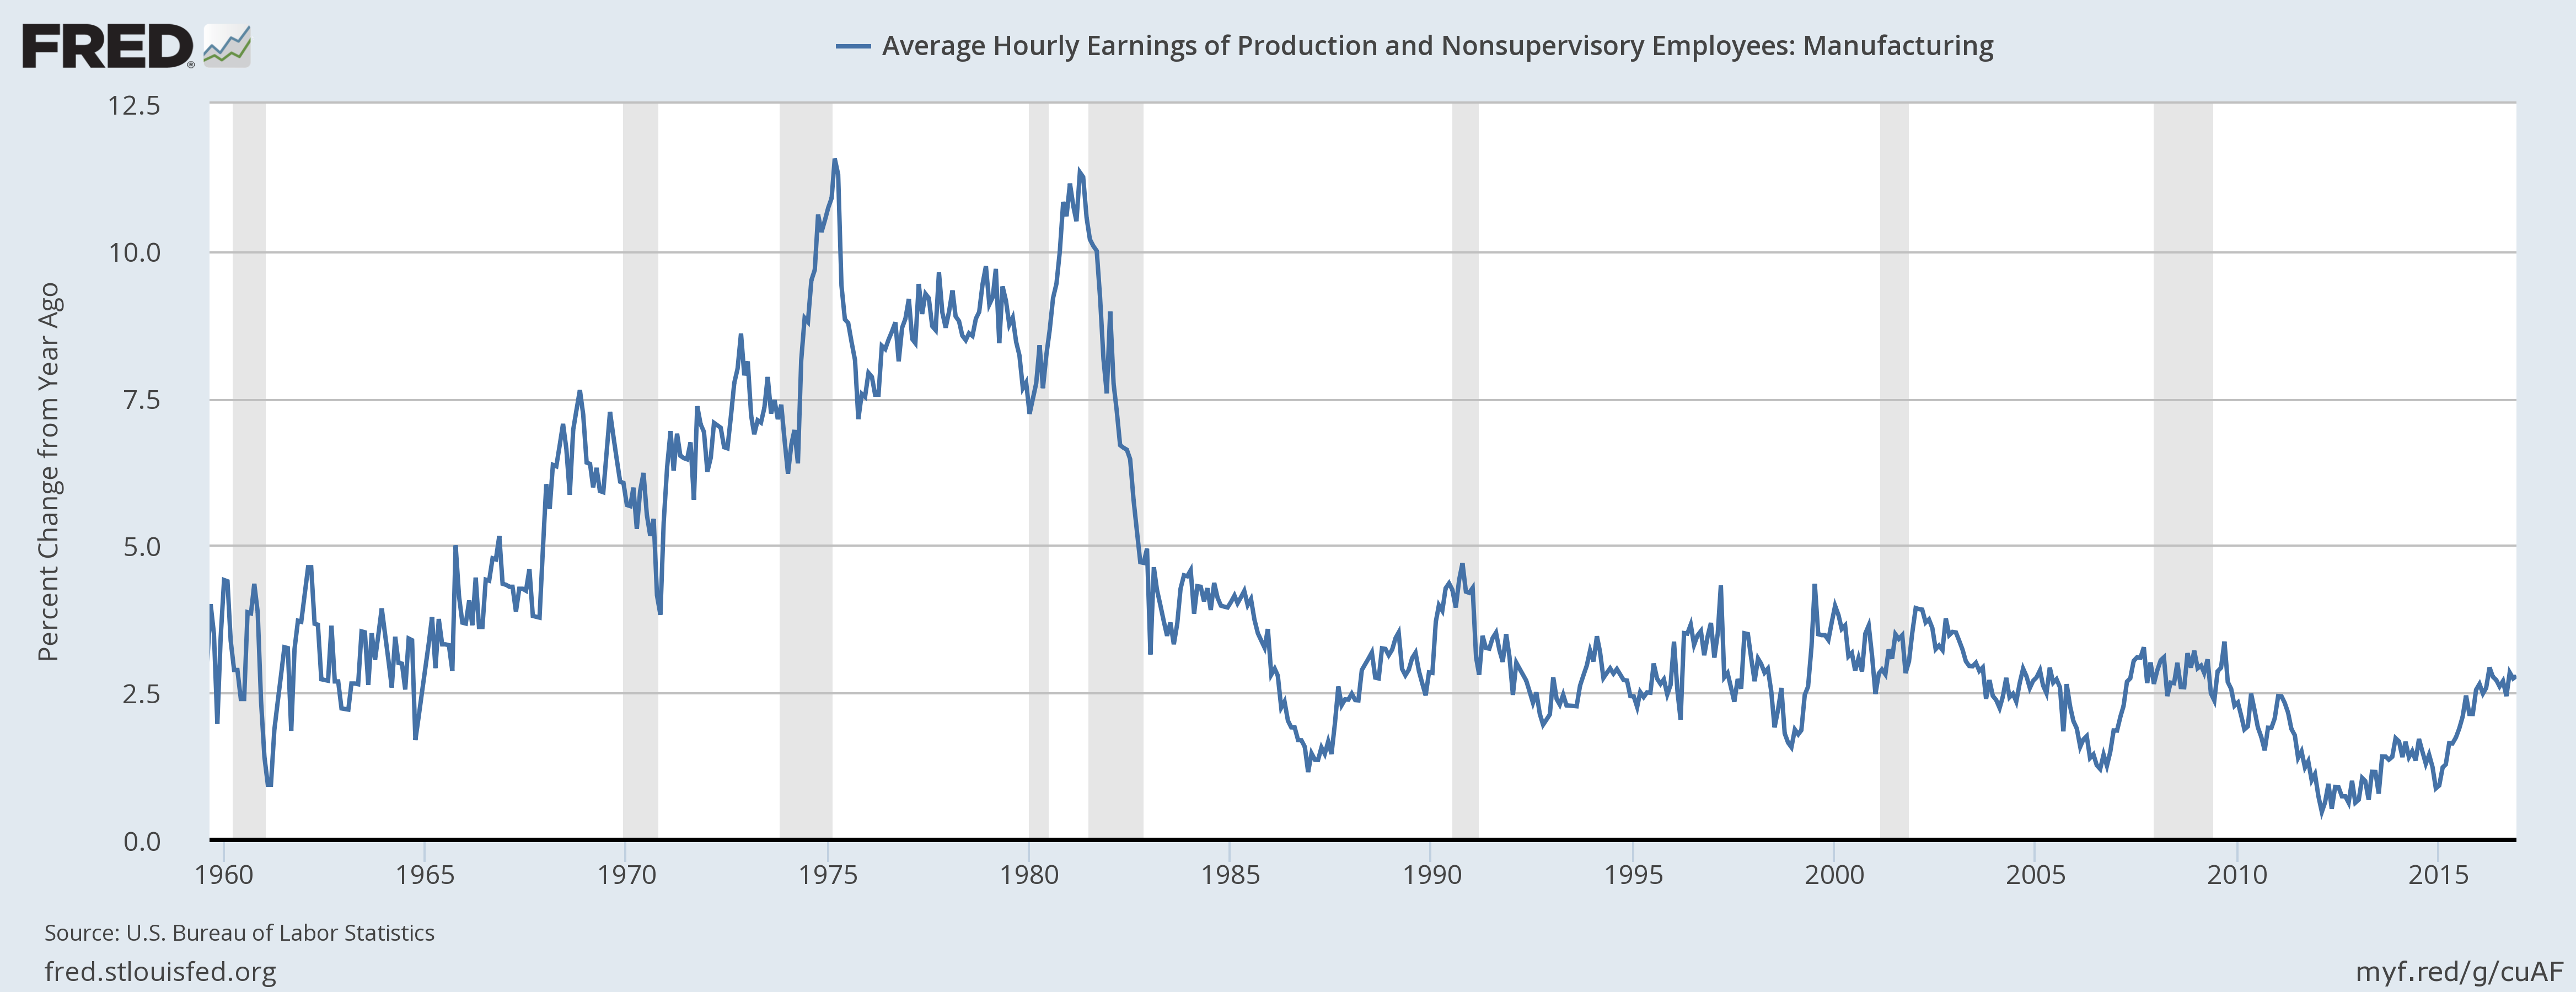
- The first chart shows the average hourly earnings of production and non-supervisory employees in manufacturing since 1960. For two decades, manufacturing wages in the United States were rising and it rose from 1.5 percent in 1960 to as high as 11 percent y/y in 1981. But after the 82 recession, wages turned stagnant and the payroll growth was below 3 percent y/y for the past three decades.
- The second chart is a discontinued one but paints the picture right enough to grasp the idea. It shows the percent of employment in manufacturing and it declined from 27 percent back in 1970 to 10 percent as of 2012.
- The final chart shows the number of people employed in the manufacturing sector that picked around 20 million in the 80’s but has fallen to just above 12 million, despite an increase in the population. The decline has been very rapid since the creation of the Euro in 1999 and China’s entry to WTO in 2000.


