


 Ethereum Retreats in Bitcoin’s Shadow: ETH/USD Tests Critical Support at USD 2,075
  FxWirePro- Major Crypto levels and bias summary
  BTCUSD Coils in Tight Range: Will Geopolitical Stability Trigger a Breakout Toward $80,000?
  Bitcoin Reclaims USD 71,000 Milestone: Bullish Sentiment Resurges as Geopolitical Tensions Ease
  Ethereum’s $2,200 Ceiling: Can Diplomatic Breakthroughs Dissolve the Bearish Resistance?
  Bitcoin Retreats as Geopolitical Tensions Flare: BTC/USD Dips Following Iran’s Rejection of Ceasefire


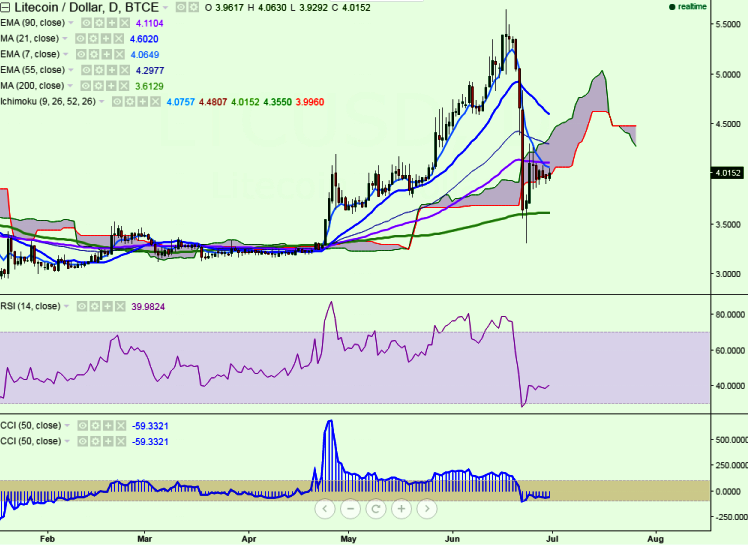
LTC/USD turned positive on Thursday, following the downtrend seen from the past two days. It has hit a high of 4.06 levels and continues to hover around this level.
Ichimoku analysis of daily chart shows:
Tenkan-Sen level: 4.07
Kijun-Sen level: 4.48
The pair faces major resistance at 4.12 (90 EMA), and a break above would see it testing 4.323 (June 24 high)/4.63 (21MA). On the other hand, support is likely to be found at 3.85 levels (June 25 low), and any weakness below this level would drag the pair to 3.60 (200 MA)/3.31 (June 23 low).

- News

- Economy

- Central Banks
- Investing
- Research
- Roundups
- Digital Currency
- Insights
- Technical Analysis
- Technology
- Business
- Law
- Health
- Nature
- Fintech
- Science
- Topic
- Opinions
- ©Econometrics LLC . All Rights Reserved.
LTC/USD turns green, further bullishness above 90 EMA
Thursday, June 30, 2016 12:23 PM UTC
Editor's Picks


- Market Data
Most Popular


