


 Ethereum Trails Bitcoin’s Retreat: Key Support Levels in Focus
  Bitcoin Retreats as Geopolitical Tensions Flare: BTC/USD Dips Following Iran’s Rejection of Ceasefire
  BTCUSD Coils in Tight Range: Will Geopolitical Stability Trigger a Breakout Toward $80,000?
  Ethereum Steady Above USD 2,000: ETH Tracks Bitcoin’s Lead as Bulls Eye a USD 2,770 Breakout


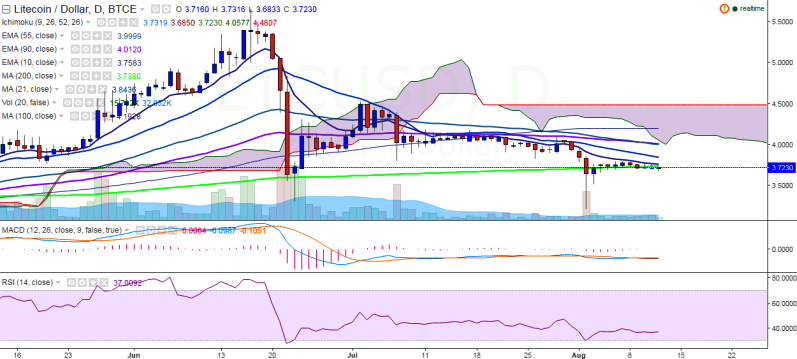
LTC/USD is struggling to close above 200-day MA and continues to hover around this level. It is currently trading at 3.72 levels (BTC-e).
Ichimoku analysis of daily chart:
Tenkan Sen: 3.66
Kijun Sen: 3.70
Trend reversal: 3.73 (200 MA)
The pair’s seems to be capped by 10 EMA, and a break above would see minor bullish trend. On the upside, major resistance is seen at 3.73 levels (200 MA) and a consistent break above could see the pair testing 4.01 levels (90 EMA)/4.19 (100 MA).
On the flipside, support is likely to be found at 3.51 (50% retracement of 3.22 and 3.80) and a break below would drag the pair to 3.31 (June 23 low)/3.14.

- News

- Economy

- Central Banks
- Investing
- Research
- Roundups
- Digital Currency
- Insights
- Technical Analysis
- Technology
- Business
- Law
- Health
- Nature
- Fintech
- Science
- Topic
- Opinions
- ©Econometrics LLC . All Rights Reserved.
LTC/USD hovers around 200-day MA, close above confirms bullishness
Friday, August 12, 2016 12:32 PM UTC
Editor's Picks


- Market Data
Most Popular


