


 BTCUSD Coils in Tight Range: Will Geopolitical Stability Trigger a Breakout Toward $80,000?
  Bitcoin Retreats Toward Critical Support as Geopolitical Winds Shift
  FxWirePro- Major Crypto levels and bias summary
  Ethereum Retreats in Bitcoin’s Shadow: ETH/USD Tests Critical Support at USD 2,075
  Ethereum’s $2,200 Ceiling: Can Diplomatic Breakthroughs Dissolve the Bearish Resistance?
  FxWirePro- Major Crypto levels and bias summary
  FxWirePro- Major Crypto levels and bias summary


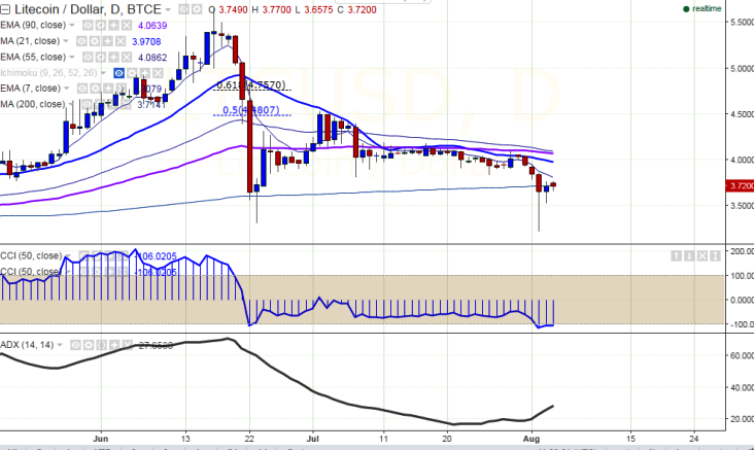
LTC/USD is hovering around 200-day MA, after hitting 3.76 levels earlier in the day. It is currently trading at 3.69 levels (BTC-e) at the time of writing.
Ichimoku analysis of daily chart:
Tenkan Sen: 3.66
Kijun Sen: 3.70
Trend reversal: 3.70 (200 DMA)
The pair is trading in the red and long-term trend appears weak. A close below 200-day MA would suggest further weakness in the pair.
Major resistance is seen at 3.83 levels (7 EMA) and a break above would target 4.07 levels (90 EMA)/4.53 (July 2 high). On the reverse side, support is likely to be found at 3.31 levels (June 23 low), and a break below would drag the pair to 3.22 levels (August 2 low)/3.15 (113% retracement of 3.31 and 4.53).

- News

- Economy

- Central Banks
- Investing
- Research
- Roundups
- Digital Currency
- Insights
- Technical Analysis
- Technology
- Business
- Law
- Health
- Nature
- Fintech
- Science
- Topic
- Opinions
- ©Econometrics LLC . All Rights Reserved.
LTC/USD hovers around 200-day MA at 3.71, close below targets 3.15
Thursday, August 4, 2016 11:43 AM UTC
Editor's Picks


- Market Data
Most Popular


